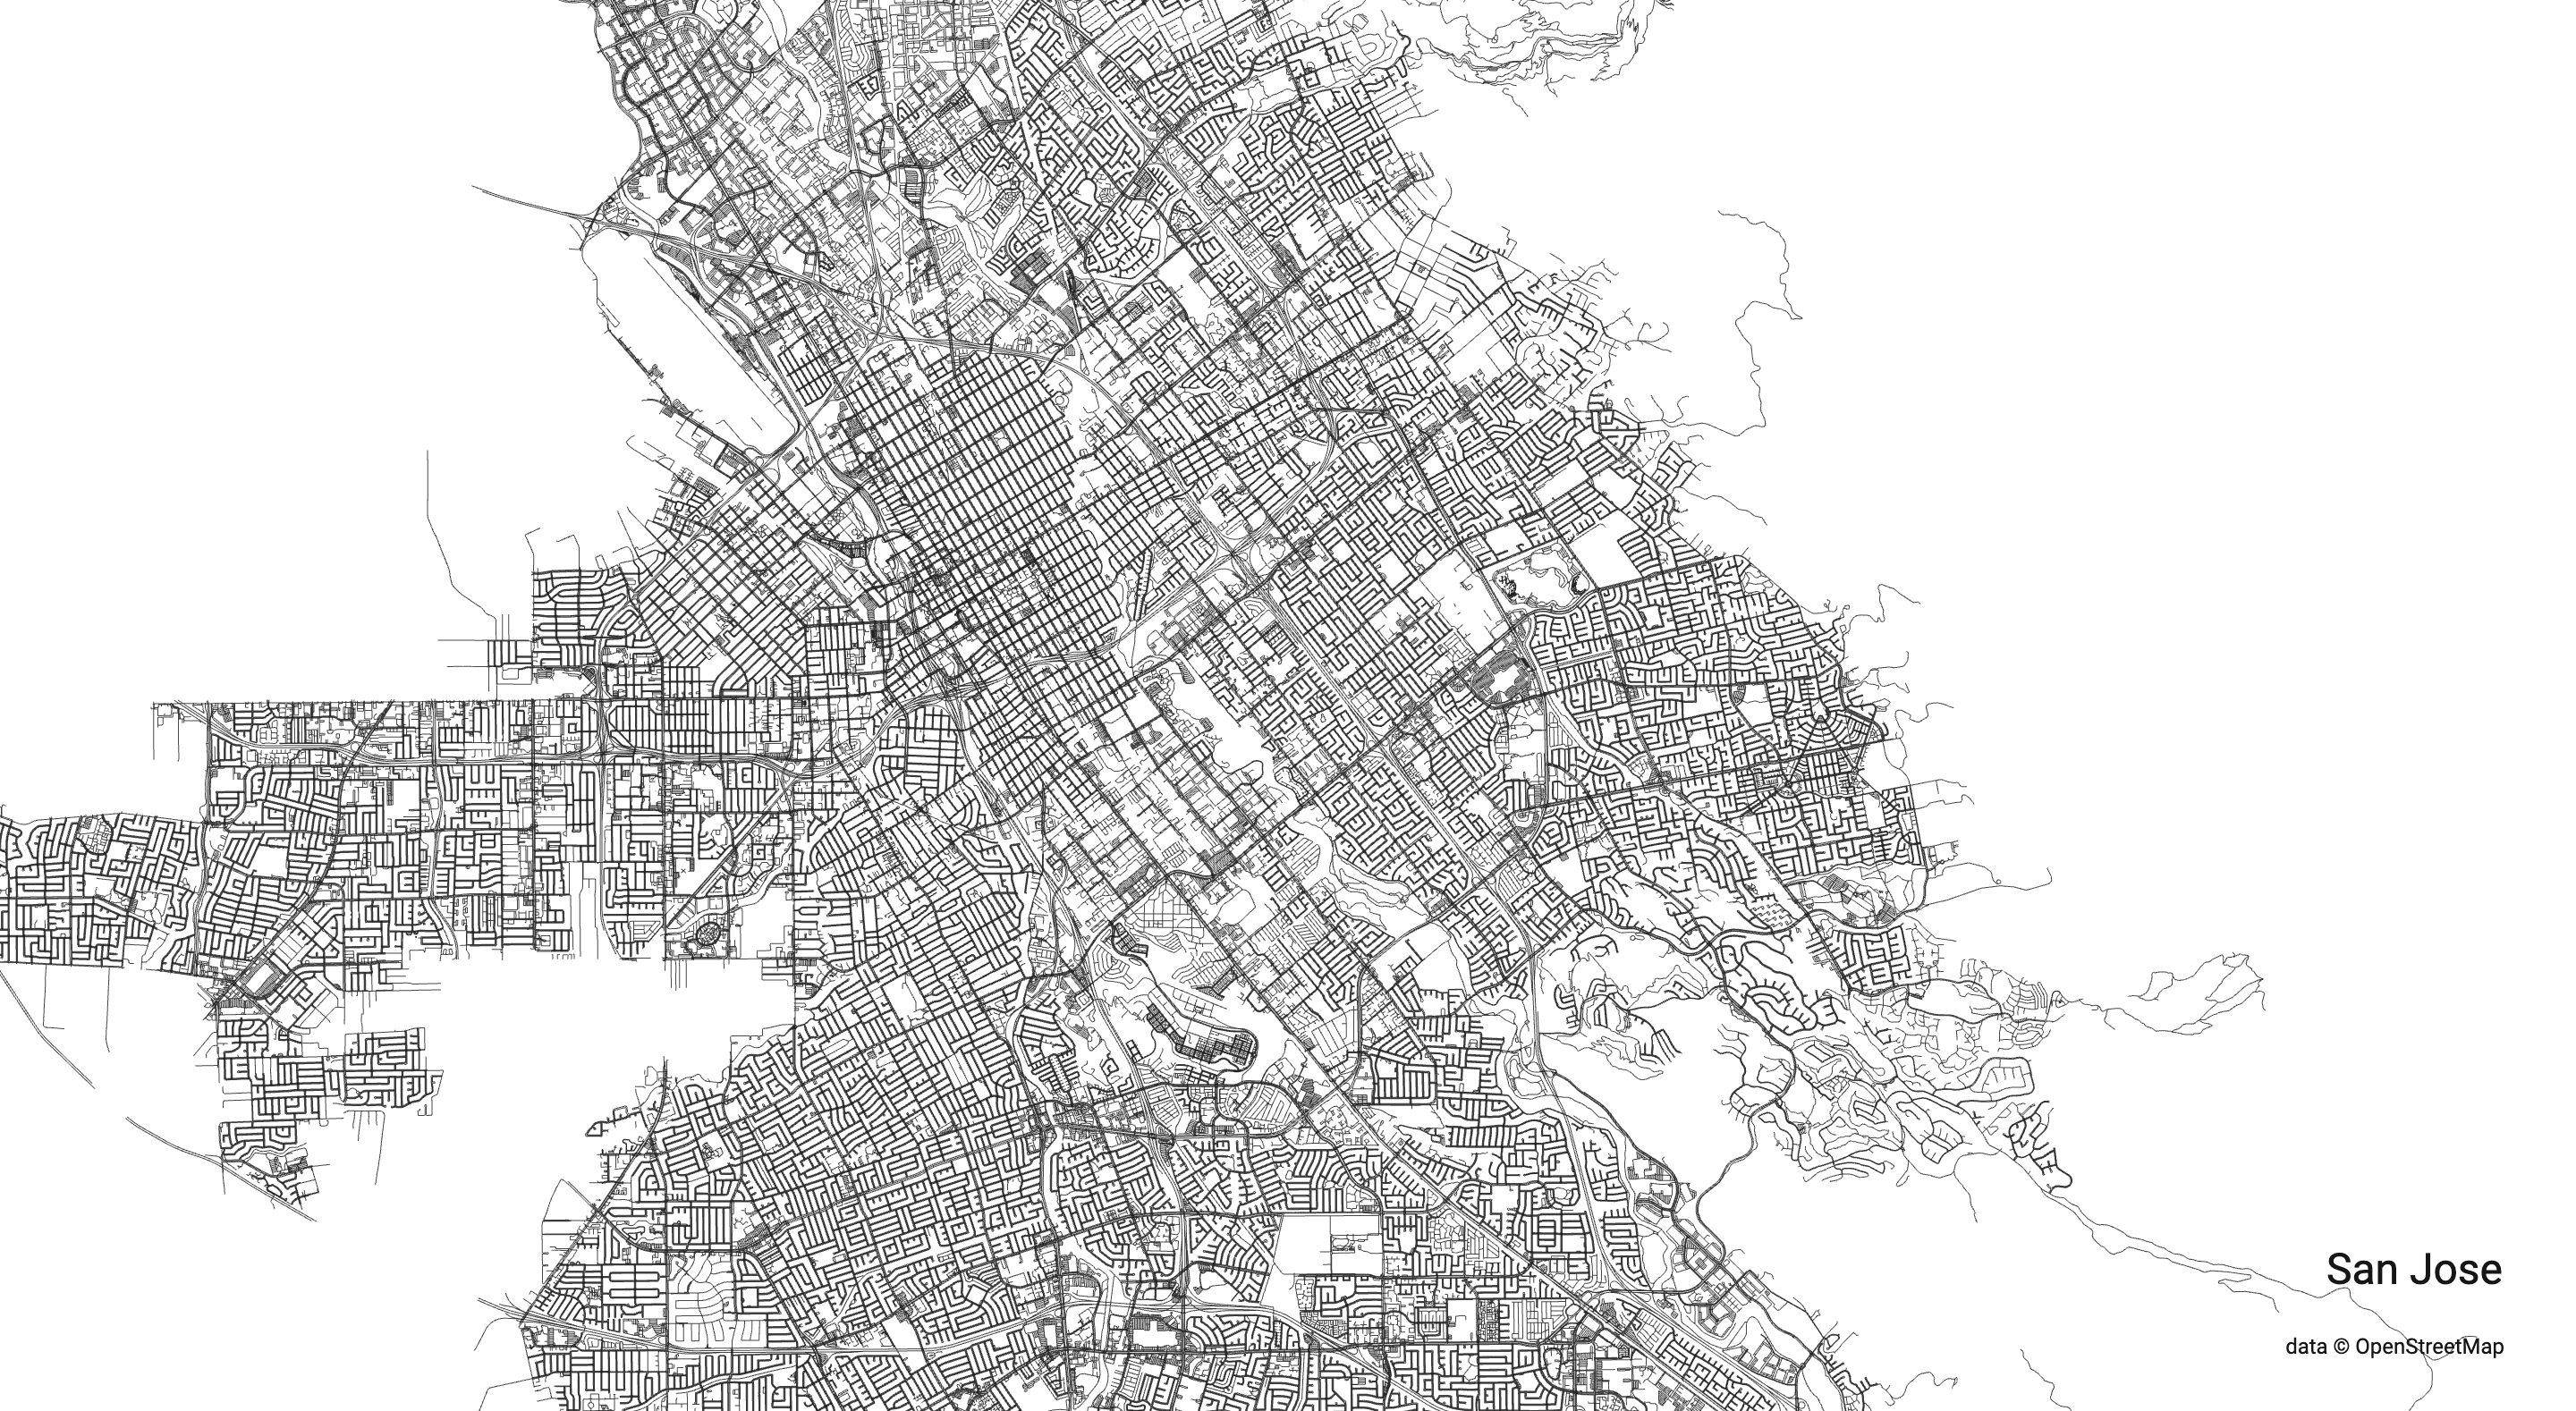
City Roads is a cool SVG generator that creates a “SVG map” of the inputted city. I’ve never realized how mapping, and creating art about maps, to be such an appropriate way to use the plotters, where I think map generation and doing that with plotters feels like a match made in heaven. I generated a SVG (well over 1000 megabytes) of my hometown San Jose, CA. Here is a PNG of it which I downloaded, since the SVG was too large. The detail is impressive, and it’s interesting to think about how accurate exactly is the SVG. Could a map like this be useful (without street names or addresses)

I also snooped through the discord group for DrawingBots and came across an SVG Optimizer – an svg optimizer that uses node.js-based tools in optimizing SVGs. The program can be installed at https://github.com/svg/svgo.
Software related information and tools are linked in the channel ‘software’ section under ‘PLOTTERS’, where people share a lot of helpful resources like plug-ins and programs that make plotting more efficient.
I also found a vpype plug in – called deduplicate – that removes overlapping lines in SVGs
GitHub – LoicGoulefert/deduplicate: Remove overlapping lines in SVG…