Observations:
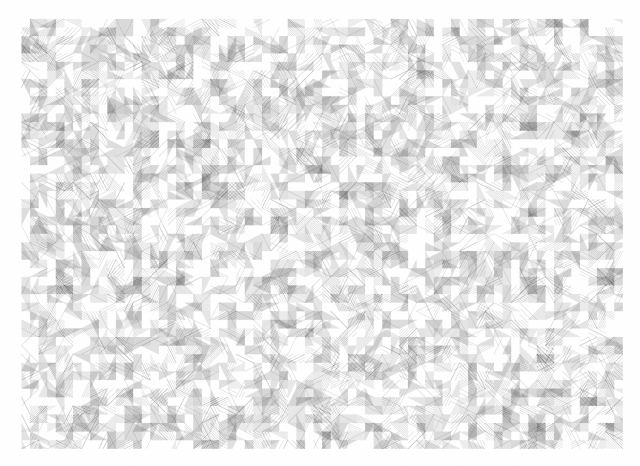
1. grid of equally spaced squares
2. some squares are split
3. areas are shaded by 'hatching'
4. some areas are split into a triangle
5. the hatching concentration varies
6. sometimes there is no hatching (blank area)
7. hatched areas overlap into cross-hatches
8. there stroke color is black
9. there are some inconsistencies with the hatching
10. the hatching direction is variable
 ^^ SVG ^^
 ^^ pixel image (from before I messed up the code) ^^
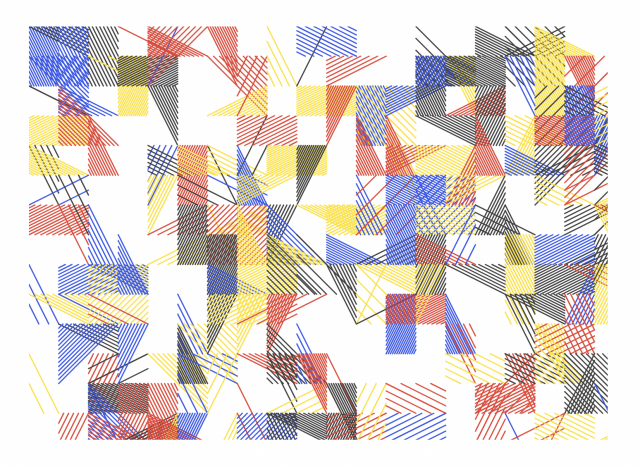 ^^ I also experimented with color ^^
LIVE EXAMPLE + CODE
^^ I also experimented with color ^^
LIVE EXAMPLE + CODE
let rows, cols, grain = 15
let colors = ['#eb4034', '#3459eb', '#ffe019', '#404040']

function setup() {
  var SQ_SIZE = min(windowWidth, windowHeight) * .75
  createCanvas(SQ_SIZE, SQ_SIZE, SVG).position((windowWidth - width) / 2, (windowHeight - height) / 2)

  rows = int(width / grain)
  cols = int(height / grain)
  stroke(0)
  strokeWeight(map(grain, 10, 100, .1, 5))
  strokeCap(ROUND)
  noLoop()
}

function draw() {
  background(255)

  for (var i = 0; i < rows; i++) {
    for (var j = 0; j < cols; j++) {

      if (random(0, 1) < .2) {
        drawHatchedRect(i * grain, j * grain, 2 * grain, 2 * grain)
      }
      else {
        if (random(0, 1) < .5) drawHatchedRect(i * grain, j * grain, grain, 2 * grain)
        if (random(0, 1) < .5) drawHatchedRect(i * grain, j * grain, 2 * grain, grain)
      }

    }
  }
}

function drawHatchedRect(x, y, w, h) {

  let divisions = int(random(-3, 10))
  let hatch_dir = random(0, 1) < 0.5
  let sided = random(0, 1) < 0.5

  push()
  translate(x, y)
  if (hatch_dir) {
    rotate(PI/2)
    var temp = w
    w = h
    h = temp
    translate(0, -h)
  }

  // define points
  var top = new p5.Vector(0, 0)
  var bot = new p5.Vector(w, h)
  var rand = random(0, 1) < 0.5
  // stroke(color(random(colors)))

  for (var i = 0; i < divisions; i++) {

    var x_off = i * (w / divisions)
    var y_off = i * (h / divisions)

    if (sided) {
      if (rand) line(top.x, top.y + y_off, bot.x - x_off, bot.y)
      else line(top.x + x_off, top.y, bot.x, bot.y - y_off)
    }
    else {
      line(top.x, top.y + y_off, bot.x - x_off, bot.y)
      line(top.x + x_off, top.y, bot.x, bot.y - y_off)
    }
  }
  pop()

}

function reDraw() {
  grain = int(random(10, 50))
  setup()
  redraw()
}

function mousePressed() {reDraw()}

function keyPressed() {
  if (key == 'd') {
      save('plot.svg')
  }
}

function windowResized() {
  setup()
  reDraw()
}