![[OLD FALL 2018] 15-104 • Introduction to Computing for Creative Practice](https://courses.ideate.cmu.edu/15-104/f2018/wp-content/uploads/2020/08/stop-banner.png)
// Sara Frankel
// sfrankel
// Project 07
// Section A

function setup() {
    createCanvas(480, 480);
}

var perwidth = 480.0;
var constrainmin = 1.0;
var constrainmax = 1.4;

function draw() {

	background('pink');
	var changecenter = width/4 * mouseX / perwidth * constrain(1 - (mouseY / perwidth), constrainmin, constrainmax); // variable to insert into drawDevilsCurve to help assiciate its position from the
																													// center curbe proportionately in both the x and y direction with the mouse

	//center curve
	drawDevilsCurve(true, width/2, height/2, 180, 150, 100);
	drawDevilsCurve(false, width/2, height/2, 180, 150, 100);

	//top left curve
	drawDevilsCurve(true, width/2 - changecenter, height/2 - changecenter, 40, 30, 35);
	drawDevilsCurve(false, width/2 - changecenter, height/2 - changecenter, 40, 30, 35);

	//bottom left curve
	drawDevilsCurve(true, width/2 - changecenter, height/2 + changecenter, 40, 30, 35);
	drawDevilsCurve(false, width/2 - changecenter, height/2 + changecenter, 40, 30, 35);

	//top right curve
	drawDevilsCurve(true, width/2 + changecenter, height/2 - changecenter, 40, 30, 35);
	drawDevilsCurve(false, width/2 + changecenter, height/2 - changecenter, 40, 30, 35);

	//bottom right curve
	drawDevilsCurve(true, width/2 + changecenter, height/2 + changecenter, 40, 30, 35);
	drawDevilsCurve(false, width/2 + changecenter, height/2 + changecenter, 40, 30, 35);
}

//-------------------------------------------------------

function drawDevilsCurve(isSide, centerX, centerY, maxA, maxB, nPoints) {

	var x;
	var y;
	var hx = mouseX / perwidth; //puts mouseX on a percent scale
	var hy = mouseY / perwidth; //mouseY on a percent scale
	var a = maxA * hx; //correlates maxA and hx for shape below
	var b = maxB * hy; //correlates maxB and hy for shape below
	var t = radians(2 * a); //angle of shape in relation to a

	beginShape();
	for (var i = 0; i < nPoints; i++) { //for loop to create the devils curve shape

		colorMode(HSB);
		stroke(280 * i, map(100 - i, 100, 0, 60, 0), 100 * i); //maps the color so that each curve corrolates in color (dependant on how many points are on the shape) in terms of pink

		var t = map(i, 0, nPoints, 0, TWO_PI); //maps the angle of the curve to corrolate with the number of points and i
		x = cos(t) * sqrt(((a * a) * (sin(t) * sin(t)) - (b * b) * (cos(t) * cos(t)) / (sin(t) * sin(t)) - (cos(t) * cos(t))));
		y = sin(t) * sqrt(((a * a) * (sin(t) * sin(t)) - (b * b) * (cos(t) * cos(t)) / (sin(t) * sin(t)) - (cos(t) * cos(t))));

		if(isSide){ //if statement that flips the curve over y=x so that it creates the same curve perpendicular to the original
			var temp = x;
			x = y;
			y = temp;
		}

		vertex(x + centerX, y + centerY); //draws curve
		vertex(-x + centerX, -y + centerY);	//draws inverse of curve (gives it the cool pointy look)

	}

	endShape(CLOSE);
	noFill();


}
When I was looking through the catalog of curves, there was something that caught my eye about the devils curve. The proportions and visual aspects fascinated me. I decided to make almost these flower shapes in proportion of one another (as well as the mouse) and track along more or less the y = x plane. Screenshots as follow:
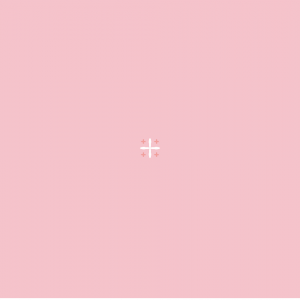
Pictured is what to expect when the shape is almost as small as it can go. It is a plus shape surrounded by smaller “+”s.
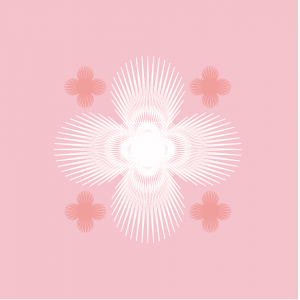
Pictured is medium size expected when x and y are closer to the center