![[OLD FALL 2018] 15-104 • Introduction to Computing for Creative Practice](https://courses.ideate.cmu.edu/15-104/f2018/wp-content/uploads/2020/08/stop-banner.png)
While browsing previous week’s looking outwards responses, I stumbled upon Jessica’s article from Week 7 on data visualizations. She chose to write about a New York Times Graph that displays how different demographics spend their time throughout the day.
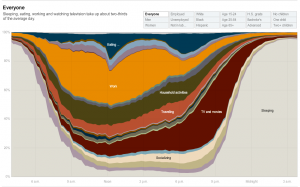
I agree that the creator’s artistic touch was manifested in the composition and intrinsic complexity of the data being represented. Though the graph doesn’t look extraordinarily eye catching, the data it represents is fascinating and the way it has been organized makes it intuitive to understand. It is difficult to have the results displayed in a data visualization obvious at first glance. As more facets are added to the data, the more information and variables must be squished into one visual, and things can get messy. The creator of this visualization elegantly combined a huge amount of data in a way that can be understood immediately.