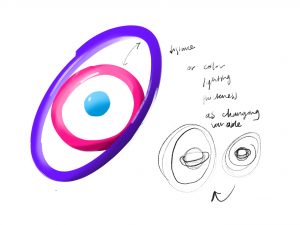
Jenny Hu — Looking Outwards 07

*the above video is the composed music alongside the data-visualization piece. (captioning not available)

Bruises— The Data that we don’t see, is a piece by Giorgia Lupi and Kaki King that uses Data Visualization to ask the following question:

“can a data visualization evoke empathy and activate us also at an emotional level, and not only at a cognitive one? Can looking at a data visualization make you feel part of a story of a human’s life?

What I love about this piece, is that the designers are not just asking how data is scientific and computational, but also sensorial. This piece, in particular, takes in information about a child’s clinical records and her emotional experience as her body changes.

a complete key to the visual piece
The full visual image

To read more about the piece, please read their medium article.

Jenny Hu — Project 07 Curves

jenny’s sketch

//Jenny Hu
//Section E
//jjh1@andrew.cmu.edu
//Project 07


var nPoints = 250;


function setup() {
    createCanvas(450, 450);
  }


function draw() {
    background(250);
    
    // draw the curve
    push();
    translate(width / 2, height / 2);
    HypotrochoidCurves();
    pop();
}


///////


function HypotrochoidCurves() {

    var x;
    var y;
    var a = 90.0;
    var a2 = 30.0;

    var b = a / 2.0;
    var b2 = a2 / 10;
    var b3 = a / 15;

    var h1 = constrain(mouseY/2, 0, width/5);
    var h2 = constrain(mouseY/8, 0, width/2);
    var h3 = constrain(mouseX/5, 0, width/5);
    var h4 = constrain(mouseX/15, 0, width/10);

    var ph1 = mouseX / 50.0;
    var ph2 = mouseY / 25.0;


    // Hypotrochoid Curve 1 (light purple)
    fill(210, 200, 250);
    stroke(255);
    strokeWeight(2);

    beginShape();
    for (var i = 0; i < nPoints; i++) {
        var t = map(i, 0, nPoints, 0, TWO_PI);
        
        x = (a2 + b3) * cos(t) + h1 * cos(ph2 + t * (a2 + b3) / b3);
        y = (a2 + b3) * sin(t) - h1 * sin(ph2 + t * (a2 + b3) / b3);
        vertex(x, y);
    }
    endShape(CLOSE);


    // Hypotrochoid Curve 2 (Pink)
    fill(255, 200, 200);
    stroke(255);
    strokeWeight(2);

    beginShape();
    for (var i = 0; i < nPoints; i++) {
        var t = map(i, 0, nPoints, 0, TWO_PI);
        
        x = (a + b) * cos(t) + h2 * cos(ph1 + t * (a + b) / b);
        y = (a + b) * sin(t) - h2 * sin(ph1 + t * (a + b) / b);
        vertex(x, y);
    }
    endShape(CLOSE);

    // Hypotrochoid Curve 3 (Purple)
    fill(100, 110, 200);
    stroke(255);
    strokeWeight(2);
    beginShape();

    for (var i = 0; i < nPoints; i++) {
        var t = map(i, 0, nPoints, 0, TWO_PI);
        
        x = (a + b) * cos(t) + h3 * cos(ph2 + t * (a + b) / b);
        y = (a + b) * sin(t) - h3 * sin(ph2 + t * (a + b) / b);
        vertex(x, y);
    }
    endShape(CLOSE);

    // Hypotrochoid Curve 4 (green)
    fill(50, 210, 200);
    stroke(255);
    strokeWeight(2);
    beginShape();

    for (var i = 0; i < nPoints; i++) {
        var t = map(i, 0, nPoints, 0, TWO_PI);
        
        x = (a2 + b2) * cos(t) + h4 * cos(ph2 + t * (a2 + b2) / b2);
        y = (a2 + b2) * sin(t) - h4 * sin(ph2 + t * (a2 + b2) / b2);
        vertex(x, y);
    }
    endShape(CLOSE);
    
}

For this project, I created a layered set of different Hypotrochoids.  These parametric forms are altered differently and independently based on mouseX and mouseY. I found the Epitrochoid example from the blog really inspiring for its globby, blobby shape and movement and wanted to do the same for a roulette-like shape.

Please see the different shots below!

program capture in a simpler state
program capture in a complex state

Jenny Hu — Looking Outwards 06

Zach Lieberman is an artist and programmer that specializes in computational and graphic art. I’m especially drawn to the pieces below for his beautifully generated compositions that blend random color juxtapositions beautifully. In terms of how it was generated, I assume the placement, colors, and direction of each shape are randomly generated each time, while the key visual qualities remain consistent in the algorithm— the diffusion rates of colors, the shapes of each point, and the spacing of the stripes in the composition.

The ability to visually balance these elements despite the randomness is what I absolutely love about these compositions. The randomness is used with a purpose that is artistically driven and envisioned.

Find this work’s post here: https://www.instagram.com/p/BlrG6iZg8Ow/?taken-by=zach.lieberman

“Tried stripes for print” — 01
“Tried stripes for print” — 02
“Tried stripes for print” — 03
“Tried stripes for print” — 04

Jenny Hu — Project 06: Abstract Clock

jenny’s sketch

//Jenny Hu
//Section E
//jjh1@andrew.cmu.edu
//Project 06

//sphere beats with the second
//torus' grow with the minute & hour

var sphereR = 29;
var smallTR = 30;
var largeTR = 100;
var sThick = 8;
var lThick = 25;
var buffer = 50;
var sphereToggle = 1;


function setup(){
  createCanvas(480, 480, WEBGL);
}


function draw(){
  background(250);
  normalMaterial();
  var M = minute();
  var H = hour();

  //inner sphere as seconds 
  //pulsed with a framerate calculation below
  for (var i=0; i<2; i++){
      //if statements isolate if the sphere is growing/shrinking
      if (sphereR < 30) {
          sphereToggle = 1; 
      }
      if (sphereR > 32.5) {
          sphereToggle = -1;   
      }
          // pulse per beat = 5/60
          // aka sphereR units traveled/60 frames
      sphereR = sphereR + i*(5/60)*sphereToggle; 
      sphere(sphereR);       
   }
  
  //middle torus radius as the minutes
  smallTR = 35 + buffer/3 + M;
  push();
  rotateZ((frameCount * 0.01)/2);
  rotateX((frameCount * 0.01)/2);
  rotateY((frameCount * 0.01)/2);
  torus(smallTR, sThick);
  pop();

  //outer torus radius as the hour
  largeTR = smallTR + sThick + buffer + H;
  push();
  rotateZ((frameCount * 0.02)/5);
  rotateX((frameCount * 0.005)/2);
  rotateY((frameCount * 0.005)/2);
  torus(largeTR, lThick);
  pop();

}

Exciting! I wanted to use this project as an excuse to just get familiar with basic WebGL and 3D primitives. (My main references to learn these are the in the links at the end.) Outside of the 3D elements— this clock is relatively straightforward— the inner sphere pulses ( in, out, and back in) per second in a simple for-loop, calculated by the distance it needs to pulse over the framerate (60). The inner torus radius is growing based on the minutes of the hour, while the outer torus radius is growing based on the hour of the day. Since the change is so slow, you can see the comparison of the smallest and largest times of the day below— midnight and 11:59 pm.

Clock at 11:59 PM — representing the largest possible radii for the hours and minutes— 23, and 59.
Clock at midnight— representing the smallest possible radii for the two torus. 0 and 0.


The rotations of each torus are essentially just coded with numbers to provide diverse volumes and angles in a given moment (basically, I just proportioned thicknesses and speeds by eye).

Resources:
The Coding Train — Light and Material Tutorial
P5 3D Geometry example reference
Getting started on WebGL

I was also super inspired by Syed Reza’s work. I hope I can produce something with similar confidence and complexity soon!

Sketches:

Sketch drawn in ProCreate.

Jenny Hu — Looking Outwards 05

project titled 227 :: blooming thoughts, created in blender
post titled 234 :: breeze
post titled 395 :: testing


Agatha Yu is a Designer at Oculus. Most of her non-Oculus related though exists on her  Instagram where she frequently posts 3D Graphic Art. I think what I admire a lot about her work is the ability to bring her personality and her childhood into the art she creates. The sensibility placed in the motion creates a style that is both grounded in reality while also being completely fictional.

I think this really speaks to the power of generated 3D realities (especially within the realm of VR), and the opportunities it brings to establish new perceptions of physics, the way things work together, and the interactions we can have with objects and the digital realm.


Jenny Hu — Project 05 Wallpaper

sketch

//Jenny Hu
//Section E
//jjh1@andrew.cmu.edu
//Project 05

var x = 0;
var y = 0;
var tileWidth = 42;
var ellipseW = 10;
var arcW = 2;
var width = 40;
var height = 40;
var ox = 20;

function setup() {
    createCanvas(480, 480);
    background(0);
    angleMode(DEGREES);

    for (x = 0; x <12; x++){
        var evenOrOdd = x%2;

        if(evenOrOdd == 0){
            height = width + (sqrt(3)/2);
            //ellipse rows
            for (y = 0; y<12; y++){ 
                var placex = y*tileWidth;
                var placey = x*tileWidth;
                noFill();
                stroke(255);
                strokeWeight(1.2);

                for (var e = 0; e<12; e++){
                    var scale = 5
                    ellipse(placex+tileWidth/2,placey+tileWidth/2, 
                        ellipseW+(e*scale), ellipseW+(e*scale));

                }
        }
    }
        
        //lace rows
        if(evenOrOdd != 0){ 
            height = width + (sqrt(3)/2);
            for (y = 0; y<12; y++){
                var placex = y*tileWidth + (ox/2);
                var placey = x*tileWidth;
                var scale = 4;
                noFill();
                stroke(255);
                strokeWeight(1.5);

                //upward lace arc
                for (var e = 0; e<10; e++){
                    arc(placex + tileWidth/2, placey + tileWidth/2, 
                        arcW+e*scale, arcW+e*scale, 180, 0, CHORD);
                    arc(placex, placey + tileWidth/2, 
                        arcW+e*scale, arcW+e*scale, 180, 0, CHORD);
                }

                //downward lace arcs
                for (var s = 0; s<5; s++){
                    arc(placex + tileWidth/2, placey + tileWidth/2, 
                        arcW+s*scale, arcW+s*scale, 0, 180, CHORD);
                    arc(placex, placey + tileWidth/2, 
                        arcW+s*scale, arcW+s*scale, 0, 180, CHORD);
                }
        }

        }
    }
    noLoop();
}

I wanted to replicate and play with a sense of three-dimensional texture by overlaying moire patterns once again. Building off of one of the assignments, I thought it would be nice to replicate fabric, and drew inspiration from lace dresses (see below). For the sake of contrast, the background is black, but I’d love to see this extended into a variety of more complex patterns in the future.

This dress is from river island. I liked the simple rows that present layers of white fabric on top of one another.


Jenny Hu — Variably Dynamic String Art

jenny’s sketch

//Jenny Hu
//Section E
//jjh1@andrew.cmu.edu
//Project 04 — String Art

var R1;
var R2;
var R3;
var R4;
var G1;
var G2;
var G3;
var G4;
var B1;
var B2;
var B3;
var B4;


function setup() {
    createCanvas(400, 300);
}

function draw() {
    background (250); 

    //Draw first curve
    for ( var i=0; i<100; i++){
      stroke(R1, G1, B1);
      strokeWeight(1);
      line(i, 0 , i*5, height/2); 
    }

    //Draw second curve
    for ( var i=0; i<200; i++){
      stroke(R2, G2, B2);
      strokeWeight(0.5);
      line(i*25, 300-height/2, i*mouseX, 300); 
    }

    //Draw third curve
    for ( var i=0; i<100; i++){
      stroke(R3, G3, B3);
      strokeWeight(0.75);
      line(400-i*10, 0, i*15, 300); 
    }    

    //Draw fourth curve
    for ( var i=0; i<100; i++){
      stroke(R4, G4, B4);
      strokeWeight(0.5);
      line(400-i*(mouseX*0.5), 0, i*15, 300); 
    }  
  }

  function mousePressed(){
      // //variable stroke colors
      R1 = random(0,250);
      G1 = random(0,250);
      B1 = random(0,250);
      R2 = random(0,250);
      G2 = random(0,250);
      B2 = random(0,250);
      R3 = random(0,250);
      G3 = random(0,250);
      B3 = random(0,250);
      R4 = random(0,250);
      G4 = random(0,250);
      B4 = random(0,250);
  }


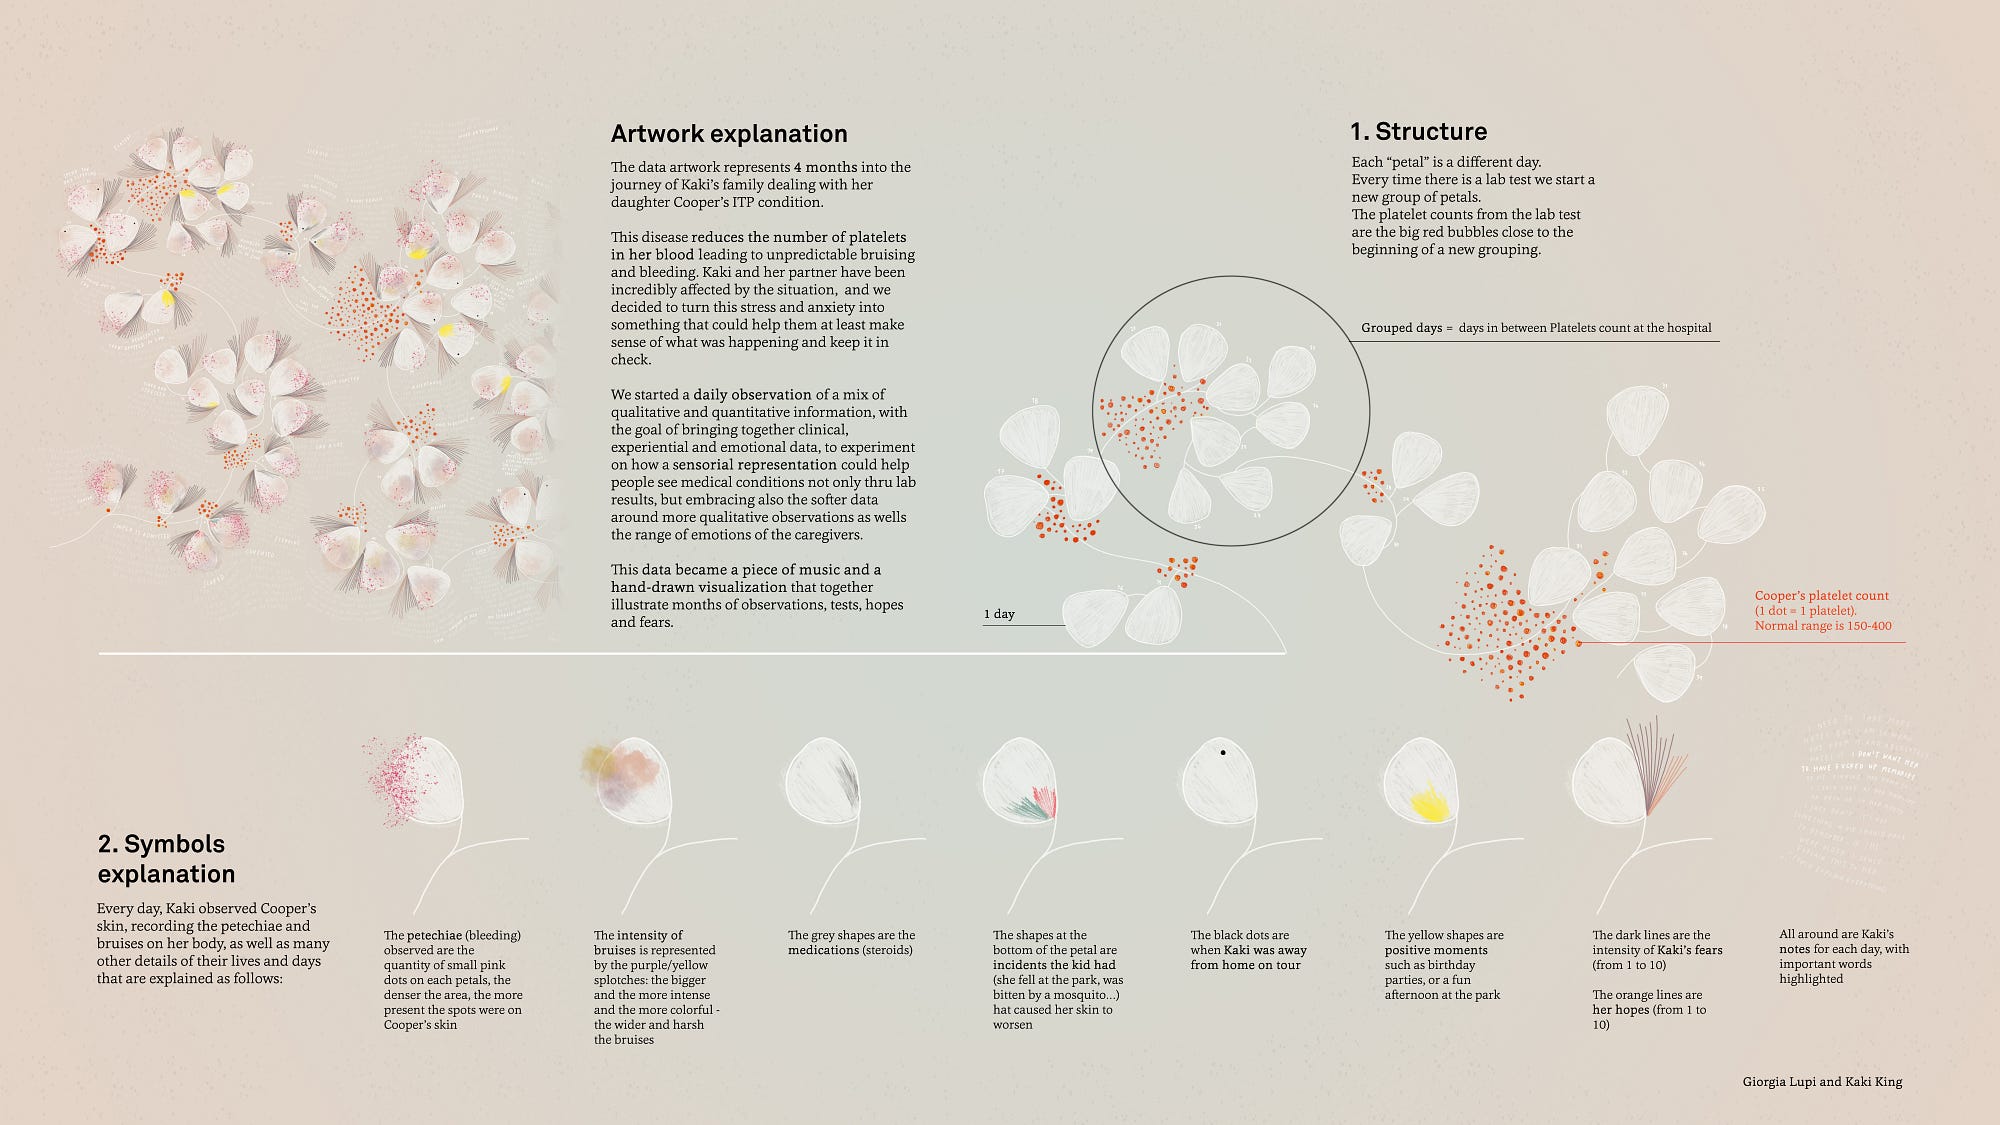
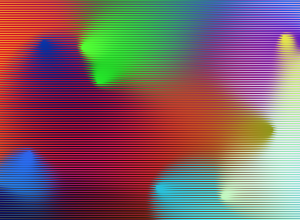
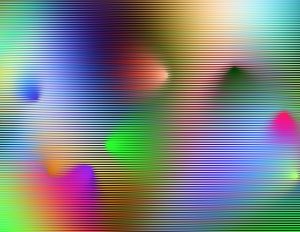
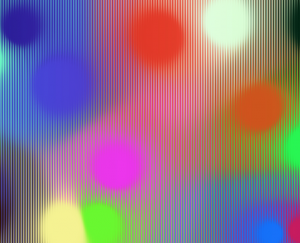
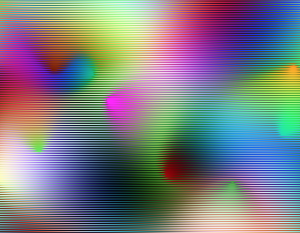
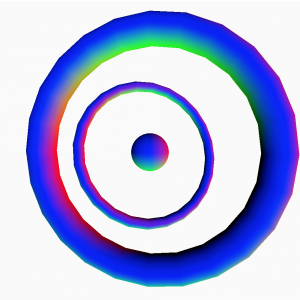
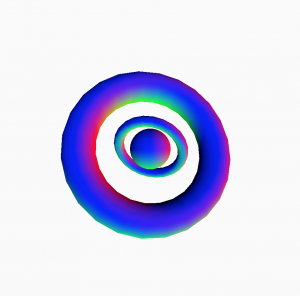
In this project, I iterated some simple for-loops for each curve. In some cases, dynamic to the mouse’s X position, and in other cases, static. I think what’s nice about the movement is that it’s a dynamic set of strings, tied to a static set, which creates a satisfying connection between their visual elements and rhythm!

This time I didn’t dabble as much in composition before writing the program, instead, I really enjoyed seeing the composition emerge as I played with the numbers. Another nice touch which makes the interactions a bit more satisfying is the additional randomized color sets.

Jenny Hu — Looking Outwards 04

Oscillating Continuum is a project by artist Ryoichi Kurokawa. Ryoichi calls this an audiovisual sculpture, where both dynamic sound-generated visuals are displayed on juxtaposed sculpture surfaces. The above video shows multiple songs documented.

While the process is not documented online, I think the video can let you assume a process where the line distances and vertices are generated based on the data from the song.  What I admire, however, is the elegance and simplicity of the artist’s creative direction. He has kept the work minimal in color and form, letting the sound generated visuals take priority. This project reminds me that data exists, but it still takes the artistic and creative vision to articulate what it means.

Jenny Hu — Looking Outwards 03

 Dio (Consummation) is a sculpture by Ben Snell, an artist based in Queens and a recent graduate of Carnegie Mellon. What I admire most about this work is actually the poetic process and perspective Ben takes. The first paragraph really says it all:

“Dio is the name of my computer. I trained it to study classical sculpture, then asked it to close its eyes and dream of a new sculpture—one which has never before been seen. Then, I ground Dio to dust and re-formed it into its dream. This sculpture is both the computer and the computer’s dream.”

This piece was generated by an algorithm, but he doesn’t go into its specifics. Instead, we’re asked to think about the algorithm as the computer’s dream, thoughts that it owns.

Jenny Hu — Dynamic Drawing

jenny’s dynamic drawing

//Jenny Hu
//Section E
//jjh1@andrew.cmu.edu
//Project 03 — Dynamic Drawing


var x1 = 320; //center of first ellipse
var y1 = 240;

var x2 = 50; 
var y2 = 240;

var x3 = 590; 
var y3 = 240;

var maxEllipse = 50;

var startD = 10; // starting diameter 
var R = 255; 
var G = 0; 
var B = 110; 

var bR = 0;
var bB = 0;

var rippleHappening = false;
var whereIsRipple = 0;//this is the number that controls where 
//the ripple is relative to the center
function setup() {
    createCanvas(640, 480);
    ellipseMode(CENTER); 
}


function draw() {
    //making background color variable
    bR = mouseX;
    bB = mouseY;
    background(bR,bB,100); 

    //Draw the ellipses
    for ( var i=0; i<maxEllipse; i++){
      noFill();

      //ellipse positions
      var x2 = mouseY - 10;
      var x3 = (width/2) - (x2-(width/2)); //make x3 move opposite of x2
      var y2 = mouseX + 10;
      var y3 = (height/2) - (y2-(height/2)); //mover y3 opposite of y2
      
      //making a ripple
      if(rippleHappening){
        //print("in the for loop?");
        if(i == int(whereIsRipple)){
          strokeWeight(6);
        }else{
          strokeWeight(2.25);
        }
      }else{
        strokeWeight(2.25);
      }


      var scale1 = (width/2-mouseX)/10; //all scale variables are to scale the space between ellipses
      var scale2 = (width/2-mouseX)/10;
      var scale3 = (width/2-mouseX)/10;

      R = mouseX;
      G = mouseX - (mouseX/2);
      B = mouseY - (mouseX/2);

      stroke(R, G, B);

      ellipse(x1,y1, startD+(i*scale1), startD+(i*scale1)); //center ellipse 
      ellipse(x2,y2, startD+(i*scale2), startD+(i*scale2)); //starting left ellipse
      ellipse(x3,y3, startD+(i*scale3), startD+(i*scale3)); //starting right ellipse

    }
    //whereIsRipple determines the ripple ellipse per set of rings 
    //if we mod the ripple, we limit it to how far the ripple goes
    whereIsRipple = (whereIsRipple+0.5)%maxEllipse;
    if(int(whereIsRipple) == (maxEllipse)){
      print("is rippleHappening turned false?");
      //turn boolean to false 
      rippleHappening = false;
    }

}
function mousePressed(){
  rippleHappening = !rippleHappening;
  whereIsRipple = 0; //start ripple at 0

}


I started this project with the intention to play with moire patterns, which is essentially patterns that come about when you overlap striped elements on top of one another (made by the gaps between the stripes). I think this was the most fun project so far because I was generated outputs I couldn’t have made without a lot more effort in other programs. It was a result that was more easily achievable via programming.

Originally, I planned the ellipsis in sketch, just to see the starting pattern, but everything else resulted from playing with the program.

You can click anywhere on the canvas to cause a continuous ripple across the ellipsis. I imagine that this can go with music one day to make a great audio visualizer! (perhaps my final project?)

special thanks to Marisa Lu, and Gautam Bose for the help.