//Jenny Hu
//Section E
//jjh1@andrew.cmu.edu
//Project 07


var nPoints = 250;


function setup() {
    createCanvas(450, 450);
  }


function draw() {
    background(250);

    // draw the curve
    push();
    translate(width / 2, height / 2);
    HypotrochoidCurves();
    pop();
}


///////


function HypotrochoidCurves() {

    var x;
    var y;
    var a = 90.0;
    var a2 = 30.0;

    var b = a / 2.0;
    var b2 = a2 / 10;
    var b3 = a / 15;

    var h1 = constrain(mouseY/2, 0, width/5);
    var h2 = constrain(mouseY/8, 0, width/2);
    var h3 = constrain(mouseX/5, 0, width/5);
    var h4 = constrain(mouseX/15, 0, width/10);

    var ph1 = mouseX / 50.0;
    var ph2 = mouseY / 25.0;


    // Hypotrochoid Curve 1 (light purple)
    fill(210, 200, 250);
    stroke(255);
    strokeWeight(2);

    beginShape();
    for (var i = 0; i < nPoints; i++) {
        var t = map(i, 0, nPoints, 0, TWO_PI);

        x = (a2 + b3) * cos(t) + h1 * cos(ph2 + t * (a2 + b3) / b3);
        y = (a2 + b3) * sin(t) - h1 * sin(ph2 + t * (a2 + b3) / b3);
        vertex(x, y);
    }
    endShape(CLOSE);


    // Hypotrochoid Curve 2 (Pink)
    fill(255, 200, 200);
    stroke(255);
    strokeWeight(2);

    beginShape();
    for (var i = 0; i < nPoints; i++) {
        var t = map(i, 0, nPoints, 0, TWO_PI);

        x = (a + b) * cos(t) + h2 * cos(ph1 + t * (a + b) / b);
        y = (a + b) * sin(t) - h2 * sin(ph1 + t * (a + b) / b);
        vertex(x, y);
    }
    endShape(CLOSE);

    // Hypotrochoid Curve 3 (Purple)
    fill(100, 110, 200);
    stroke(255);
    strokeWeight(2);
    beginShape();

    for (var i = 0; i < nPoints; i++) {
        var t = map(i, 0, nPoints, 0, TWO_PI);

        x = (a + b) * cos(t) + h3 * cos(ph2 + t * (a + b) / b);
        y = (a + b) * sin(t) - h3 * sin(ph2 + t * (a + b) / b);
        vertex(x, y);
    }
    endShape(CLOSE);

    // Hypotrochoid Curve 4 (green)
    fill(50, 210, 200);
    stroke(255);
    strokeWeight(2);
    beginShape();

    for (var i = 0; i < nPoints; i++) {
        var t = map(i, 0, nPoints, 0, TWO_PI);

        x = (a2 + b2) * cos(t) + h4 * cos(ph2 + t * (a2 + b2) / b2);
        y = (a2 + b2) * sin(t) - h4 * sin(ph2 + t * (a2 + b2) / b2);
        vertex(x, y);
    }
    endShape(CLOSE);

}
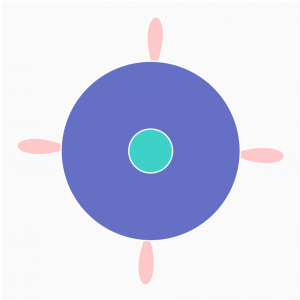
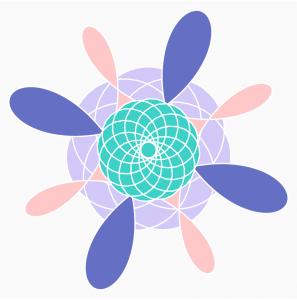
For this project, I created a layered set of different Hypotrochoids. These parametric forms are altered differently and independently based on mouseX and mouseY. I found the Epitrochoid example from the blog really inspiring for its globby, blobby shape and movement and wanted to do the same for a roulette-like shape.
Please see the different shots below!


![[OLD FALL 2018] 15-104 • Introduction to Computing for Creative Practice](https://courses.ideate.cmu.edu/15-104/f2018/wp-content/uploads/2020/08/stop-banner.png)