![[OLD FALL 2018] 15-104 • Introduction to Computing for Creative Practice](https://courses.ideate.cmu.edu/15-104/f2018/wp-content/uploads/2020/08/stop-banner.png)
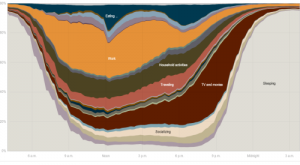
“How Different Groups Spend Their Day” by Amanda Cox displays how different types of people (unemployed, employed, etc) spend their time during the day. I was intrigued by this visual because it was amazing how one could use computation to display such practical data. One could also easily pick out the type of data they wish to extract. For example, we can see that the unemployed sleep an hour more than the employed; the unemployed also spend an extra hour for house chores. It is amazing how Amanda Cox was able to get such data and display it in a visually appealing way, using computation. This type of display was not only highly informative, but also very visually pleasing.
To see more of her artwork, please follow the link: http://amandacox.tumblr.com/post/2709495753/a-peek-into-netflix-queues