![[OLD FALL 2020] 15-104 • Introduction to Computing for Creative Practice](../../../../wp-content/uploads/2021/09/stop-banner.png)
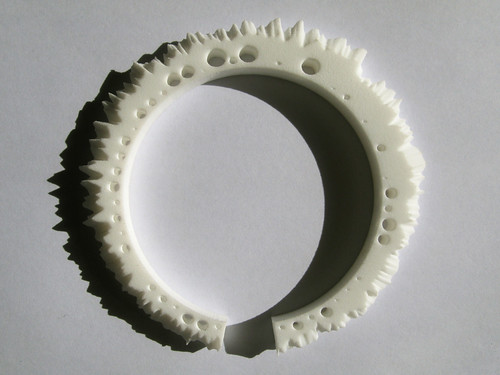
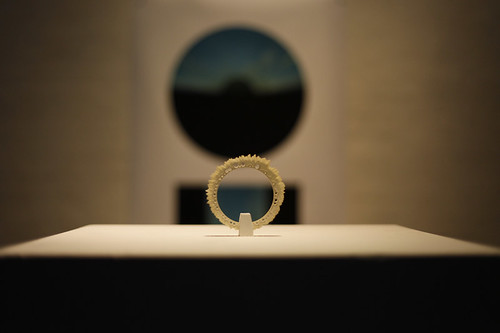
Creating the Weather Bracelet, Mitchell Whitelaw used generative design to translate the weather-data of Canberra, Australia into a fascinating jewelry piece. The height of each spike on the bracelet represents its daily maximum temperature, and the height of each spike’s shoulder represents its daily minimum. Generally, data visualization is seen in 2d form–whether it be graphic or motion graphic. However, Whitelaw’s work visualizes data as something physical as well as visual. By portraying data through an object–also known as autographic visualization–Whitelaw’s work is eye-opening and captivating. In addition to its interesting process, the final work, the bracelet itself, is intrinsically beautiful. The uneven spikes and holes provide the bracelet with complexity and a futuristic look, balancing well with its minimalistic white color.
Whitelaw accomplished most of his work by first defining a set of 3D points using beginShape() and vertex() and PVectors. To save the geometry of his object, he also used the SuperCad library to write an obj. file. He then worked in MeshLab and Blender to 3D model his bracelet before printing it out.
By utilizing the power of computation, Whitelaw was able to create a jewelry piece that is scientifically meaningful as well as personally meaningful. While making weather data tangible visually and physically, the bracelet also established a personal relationship with the wearer through the sense of touch. It facilitates an exciting experience as the wearer runs his or her fingers down the bracelet, reminiscing about the memories of different seasons and weather.
Creator: Mitchell Whitelaw
Title: The Weather Bracelet
Year: 2009
Link: http://teemingvoid.blogspot.com/2009/10/weather-bracelet-3d-printed-data.html