![[OLD FALL 2020] 15-104 • Introduction to Computing for Creative Practice](https://courses.ideate.cmu.edu/15-104/f2020/wp-content/uploads/2021/09/stop-banner.png)
As a student who works in the IDEATE space at CMU, I have really come to appreciate some of the creativity around our own University. A sonic art piece that comes to mind is in the stairwell of the Hunt library. A search on the Internet renders not much more than the name of this installation – “Acrylic plastic Ambient auditory experience”, but this product is cooler than it sounds. Using hanging light fixtures that extends from the top of the stairwell to the bottom, it responds to the sound of footsteps on the stairs and lights up the piece of the fixture closest to the sound. I really enjoy this interaction, and I think it’s a creative way to make such a boring space feel exciting and alive. It was created to emphasize the area of the library where you are allowed to make sound. In the publishing of this blog post, I have found more information about the piece – it was created by Jaime Chu and Robert Rudolph. Using clear acrylic, the designers were able to achieve and interesting floating lightbulb effect. See here:
Month: September 2020
PROJECT 04 – STRING ART
sketch
var dx1;
var dy1;
var dx2;
var dy2;
var numLines = 40;

function setup() {
    createCanvas(400, 300);
    background(0);

    line(400, 150, 400,  300)

    dx1 = (0 - 0)/numLines;
    dy1 = (200 - 0)/numLines;
    dx2 = (300 - 200)/numLines;
    dy2 = (50 - 400)/numLines;
}

//setting variables
function draw() {
    var x1 = 0;
    var y1 = 0;
    var x2 = 400;
    var y2 = 300;
    var x3 = 0;
    var y3 = 0;
    var x4 = -100;
    var y4 = height;
    var x5 = width;
    var y5 = height;

//blue and pink gradient
    for (var i = 0; i <= numLines; i += 1) {
        stroke(225-i*10, 125-i*10, 225  );
        line(x1, y1, x2, y2);
        x1 += dx1;
        y1 += dy1;
        x2 += dx2;
        y2 += dy2;
    }

//orange and green gradient
    for (var j = 0; j <= 60; j ++) {
        stroke(100+j*10, 200, 140);
        line(x4, height, width, y4);
        x4 += width/20;
        y4 -= height/20;
    }

//green on bottom left
    for (var k = 0; k <= 30; k ++) {
        stroke(25, 255, 255-k*10);
        line(0, y3, x3, height);
        x3 += width/20;
        y3 += height/20;
    }

//pink top left
    for (var z = 0; z <= 20; z ++) {
        stroke(100+z*10, 0, 140);
        line(x5, 0, width, y5);
        x5 -= width/20;
        y5 -= height/20;
    }

}
For this project, I really wanted to test out how curvatures can warp lines into creating new dimensions. I also tried to emphasize the depth by using gradients.
Project 04 – String Art
I chose to create a responsive string art project, since I still haven’t had my fill of mouseX and mouseY data use. I also used a mousePressed function to spice things up as well, ultimately changing the location of the pivot points of the string as well as the color.
sketchDownload
//PROJECT 04 STRING ART
//Julia Steinweh-Adler
//jsteinwe


var dx1;
var dy1;
var dx2;
var dy2;
var numLines = 1;
var mode = 0;

function setup() {
    createCanvas(400, 400);
    background(0);


    //line initial variables
    dx1 = (width/1) / numLines;
    dy1 = (width/2) / numLines;
    dx2 = (width/3) / numLines;
    dy2 = (width/4) / numLines;
}

function draw() {

    var x1 = mouseX;
    var y1 = mouseY;
    var ptOne = 400; // yarn pivot point, y value
    var ptTwo = 180; // yarn pivot point, x value

    stroke(0);
    strokeWeight(2);

     // Red and Blue Yarn
       if(mode == 0) {
          for (var i = 0; i < numLines; i += 1) {

             stroke(mouseX, 0, mouseY); // red blue color
             line(x1, y1, ptOne, ptTwo); //line 1

             stroke(mouseY, 0, mouseX); // red blue color
             line(y1, x1, ptTwo, ptOne); //line 2, inverted from line 1

             line(x1, y1, y1, x1); // line 3: connecting 1 and 2


            // incremental addition to coordinates
             x1 += dx1;
             y1 += dy1;
             ptOne += dx2;
             ptTwo += dy2;

          }


       } else {
          // Blue and Green Yarn


         // changing yarn pivot point
         let ptOne = 0 // yarn pivot point, x value
         let  ptTwo = 200 // yarn pivot point, y value

          for (i = 0; i < numLines; i += 1) {

          //change yarn color
             stroke(0, mouseX, mouseY); // green blue color
             line(y1, x1, ptTwo, ptOne); //line 1


             stroke(mouseY, 0, mouseX); //green blue color
             line(x1, y1, ptOne, ptTwo); //line 2, inverted line 1

             line(y1, x1, x1, y1) //line 3; connector line


              // incremental addition to coordinates
             x1 += dx1;
             y1 += dy1;
             ptOne += dx2;
             ptTwo += dy2;
             }
       }
  }
  function mousePressed() {
    if (mode == 0) {
      mode = 1;
    } else {
      mode = 0;
    }
  }
The color, repetitive nature, string-like-ness, and “stretchy” behavior of this interaction remind me of the rainbow loom. Therefore, I have titled this piece “Rainbow Loom”.

LO – 04 : SOUND ART
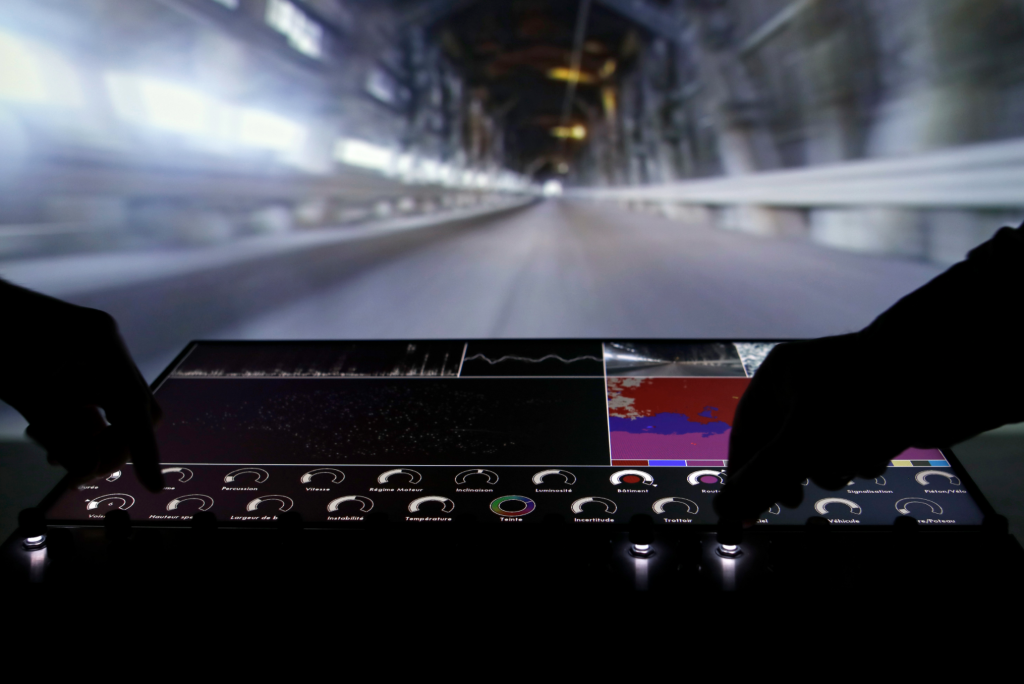
François Quévillon’s “Algorithmic Drive” is a project that I personally found to be very interesting. This project is an interactive installation that was inspired by cars and dash cams. It began with François collecting a large database of recordings from a camera attached to his car’s computer. The data collected includes information on location, orientation, speed, temperature, stabilitiy, etc. This data is fed into a sampling system that uses signal processing, data analysis, and computer vision algorithms that then begins to sort the content statistically. The information is mapped using a Uniform Manifold Approcimation and Projection dimension reduction technique.
This project was interesting to me because it utilizes data and information that surrounds us in our daily life, but is then used to create something new and creative.
Project 4 – String Art
sketch
var carWidth = 20;
var carHeight = 10;
var carA = 0;
var carB = 0;

function setup() {
    createCanvas(400, 300);
    background(220);
    text("p5.js vers 0.9.0 test.", 10, 15);
}

function draw() {
    background(146, 234, 255);
    //left cloud
    fill(235);
    noStroke();
    circle(0, 50, 50);
    circle(40, 50, 70);
    circle(80, 70, 40);
    circle(90, 40, 50);
    //right cloud
    circle(250, 100, 50);
    circle(250, 60, 60);
    circle(300, 80, 100);
    circle(340, 50, 80);
    circle(360, 90, 90);
    //sun
    fill(255, 213, 0);
    circle(200, 300, 200);
    //black car
    fill(0);
    if (carA > width) {
        carA = -carWidth
    }
    carA = carA + 1;
    rect(carA, 240, carWidth, carHeight);
    //green car
    fill(0, 255, 0);

    stroke(100, 0, 0);
    strokeWeight(1);
    push();
    //left bridge lines
    translate(-30, -50);
    for (var i = 0; i <= 120; i += 10) {
        line(0, i + 180, i + 80, 300);
    }
    //middle bridge lines
    translate(100, 0);
    stroke(50, 0, 0);
    for (var i = 0; i <= 210; i += 15) {
        line(300, i + 90, 210 - i, 300);
    }
    //bottom of bridge
    translate(-70, 0);
    for (var i = 0; i <= 12; i += 1.5) {
        line(0, i + 301, 400, i + 301);
        fill(180, 0, 0);
        rect(0, i + 301, 400, 2);
    }
    pop();
    noFill();
    //left top bridge structure
    stroke(190, 0, 0);
    strokeWeight(5);
    rect(-10, 130, 15, 25);
    rect(-10, 160, 15, 25);
    rect(-10, 190, 15, 25);
    rect(-10, 220, 15, 29);
    //left bottom bridge structure
    noStroke();
    fill(150, 0, 0);
    rect(-7, 265, 15, 50);
    //right bridge structure circles
    noFill();
    stroke(190, 0, 0);
    strokeWeight(1);
    circle(340, 35, 7);
    circle(375, 35, 7);
    //right bridge structure
    stroke(180, 0, 0);
    strokeWeight(10);
    rect(340, 41, 35, 40);
    rect(340, 86, 35, 45);
    rect(340, 136, 35, 55);
    rect(340, 186, 35, 60);
    //right bottom bridge structure
    stroke(150, 0, 0);
    rect(340, 270, 35, 50);
    line(340, 270, 375, 305);
    line(375, 270, 340, 305);
    push();
    //right bridge lines
    translate(336, -140);
    stroke(150, 0, 0);
    strokeWeight(1);
    for (var i = 0; i <= 210; i += 15) {
        line(0, i + 180, i + 180, 390);
    }
    pop();
}
My depiction of the Golden Gate Bridge in San Fransisco!
Project 04 – String Art
sketch
/*
 * Eric Zhao
 * ezhao2@andrew.cmu.edu
 *
 * Project 4: String Art
 * A dynamic string art with four separate string shapes
 * that changes based on mouse position.
 */

var angle = 0;
var posX = 0;
var posY = 0;
var cursorX;
var cursorY;
var loopCount = 0;
var numLines = 30;
function setup() {
    createCanvas(400, 400);
    background(220);
    text("p5.js vers 0.9.0 test.", 10, 15);
}

function draw(){
    stroke(255);
    strokeWeight(0.125);
    background(0);
    translate(width/2, height/2);

    push()
    cursorX = map(min(mouseX, width), -200, 200, 0, 400);
    for(let a = 0; a <= 360; a += 1){
        //rotates the canvas an increment of radians and adjusts canvas
        rotate(5);
        push();
        scale(4);
        posY = -a;
        line(-cursorX, posY, cursorX, cursorX);
        //draws lines normal to point offset after rotation
        pop();
    }
    pop();

    stroke(0, 255, 255);
    strokeWeight(0.75);


    //bottom right cyan string corner
    line(0, height/2, width/2, height/2);
    line(width/2, 0, width/2, height/2);
    numLines = int(map(constrain(mouseX, 0, 400), 0, 400, 0, 30));
    var dx1 = (0-width/2)/numLines;
    var dy1 = (height/2-height/2)/numLines;
    var dx2 = (width/2-width/2)/numLines;
    var dy2 = (height/2-0)/numLines;
    var x1 = 0;
    var y1 = height/2;
    var x2 = width/2;
    var y2 = height/2;
    for (var i = 0; i <= numLines; i += 1) {
        line(x1, y1, x2, y2);
        x1 -= dx1;
        y1 -= dy1;
        x2 -= dx2;
        y2 -= dy2;
    }

    //bottom left string corner
    line(0, height/2, -width/2, height/2);
    line(-width/2, 0, -width/2, height/2);
    dx1 = (0 + width/2)/numLines;
    dy1 = (height/2-height/2)/numLines;
    dx2 = (-width/2 - 0)/numLines;
    dy2 = (height/2-0)/numLines;
    x1 = 0;
    y1 = height/2;
    x2 = -width/2;
    y2 = height/2;
    for (var i = 0; i <= numLines; i += 1) {
        line(x1, y1, x2, y2);
        x1 -= dx1;
        y1 -= dy1;
        x2 -= dx2;
        y2 -= dy2;
    }
    rotate(PI); //rotates canvas to draw top two string corners

    //top left string part
    line(0, height/2, width/2, height/2);
    line(width/2, 0, width/2, height/2);
    numLines = int(map(constrain(mouseX, 0, 400), 0, 400, 0, 30));
    dx1 = (0-width/2)/numLines;
    dy1 = (height/2-height/2)/numLines;
    dx2 = (width/2-width/2)/numLines;
    dy2 = (height/2-0)/numLines;
    x1 = 0;
    y1 = height/2;
    x2 = width/2;
    y2 = height/2;
    for (var i = 0; i <= numLines; i += 1) {
        line(x1, y1, x2, y2);
        x1 -= dx1;
        y1 -= dy1;
        x2 -= dx2;
        y2 -= dy2;
    }
    //top right string part
    line(0, height/2, -width/2, height/2);
    line(-width/2, 0, -width/2, height/2);
    dx1 = (0 + width/2)/numLines;
    dy1 = (height/2-height/2)/numLines;
    dx2 = (-width/2 - 0)/numLines;
    dy2 = (height/2-0)/numLines;
    x1 = 0;
    y1 = height/2;
    x2 = -width/2;
    y2 = height/2;
    for (var i = 0; i <= numLines; i += 1) {
        line(x1, y1, x2, y2);
        x1 -= dx1;
        y1 -= dy1;
        x2 -= dx2;
        y2 -= dy2;
    }
}
I got the initial idea for this composition when trying to make the spiral example from a class lecture and accidentally rotating the canvas in radians instead of degrees.
Project 04 – String Art
I tried to visualize an image of eye through various shapes of string art.
sketch
//Stefanie Suk
//15-104 Section D

var ax1;
var ay1;
var ax2;
var ay2;      //variable for top left white strings

var bx1;
var by1;
var bx2;
var by2;      //variable for top right white strings

var cx1;
var cy1;
var cx2;
var cy2;      //variable for bottom right white strings

var dx1;
var dy1;
var dx2;
var dy2;      //variable for bottom left white strings

var fx1;
var fy1;
var fx2;
var fy2;      //variable for top bottom orange strings

var gx1;
var gy1;
var gx2;
var gy2;      //variable for left right orange strings

var numLines = 40;
var numLines2 = 50;

function setup() {
    createCanvas(400, 300);
    background(25, 44, 108);

    //base lines for top left white strings
    line(0, 300, 0, 0);
    line(0, 0, 400, 0);
    ax1 = (0-0)/numLines;
    ay1 = (0-300)/numLines;
    ax2 = (400-0)/numLines;
    ay2 = (0-0)/numLines;

    //base lines for top right white strings
    line(0, 0, 400, 0);
    line(400, 0, 400, 300);
    bx1 = (400-0)/numLines;
    by1 = (0-0)/numLines;
    bx2 = (400-400)/numLines;
    by2 = (300-0)/numLines;

    //base lines for bottom right white strings
    line(400, 0, 400, 300);
    line(400, 300, 0, 300);
    cx1 = (400-400)/numLines;
    cy1 = (300-0)/numLines;
    cx2 = (0-400)/numLines;
    cy2 = (300-300)/numLines;

    //base lines for bottom left white strings
    line(400, 300, 0, 300);
    line(0, 300, 0, 0);
    dx1 = (0-400)/numLines;
    dy1 = (300-300)/numLines;
    dx2 = (0-0)/numLines;
    dy2 = (0-300)/numLines;

    //base lines for top bottom orange strings
    line(200, 0, 400, 0);
    line(200, 300, 0, 300);
    fx1 = (400-200)/numLines2;
    fy1 = (0-0)/numLines2;
    fx2 = (0-200)/numLines2;
    fy2 = (300-300)/numLines2;

    //base lines for left right orange strings
    line (0, 0, 0, 150);
    line(400, 300, 400, 150);
    gx1 = (0-0)/numLines2;
    gy1 = (150-0)/numLines2;
    gx2 = (400-400)/numLines2;
    gy2 = (150-300)/numLines2;
}

function draw() {

	//center pink strings
	for (var i = 0; i < 300; i += 8) {
		stroke(255, 161, 231); //pink
		strokeWeight(1);
		line (width/2, i + 0, i + width/2, height/2); //top right
		line(width/2, height - i, i + width/2, height/2); //bottom right
        line(width/2, i + 0, width/2 - i, height/2); //top left
        line(width/2, height - i, width/2 - i, height/2); //bottom left
	}

	//top left white strings
	var x1a = 0;
	var y1a = 300;
	var x2a = 0;
	var y2a = 0;
	for (var i = 0; i <= numLines; i +=1) {
		stroke(255);
		strokeWeight(1);
		line(x1a, y1a, x2a, y2a);
		x1a += ax1;
		y1a += ay1;
		x2a += ax2;
		y2a += ay2;
	}

	//top right white strings
	var x1b = 0;
	var y1b = 0;
	var x2b = 400;
	var y2b = 0;
	for (var i = 0; i <= numLines; i +=1) {
		line(x1b, y1b, x2b, y2b);
		x1b += bx1;
		y1b += by1;
		x2b += bx2;
		y2b += by2;
	}

	//bottom right white strings
	var x1c = 400;
	var y1c = 0;
	var x2c = 400;
	var y2c = 300;
	for (var i = 0; i <= numLines; i +=1) {
		line(x1c, y1c, x2c, y2c);
		x1c += cx1;
		y1c += cy1;
		x2c += cx2;
		y2c += cy2;
	}

	//bottom left white strings
	var x1d = 400;
	var y1d = 300;
	var x2d = 0;
	var y2d = 300;
	for (var i = 0; i <= numLines; i +=1) {
		line(x1d, y1d, x2d, y2d);
		x1d += dx1;
		y1d += dy1;
		x2d += dx2;
		y2d += dy2;
	}

	//center circle yellow strings
	for (var e = 120; e <= 240; e++) {
		stroke(247, 241, 117);
		strokeWeight(1.5);
		noFill();
		ellipse(width/2, height/2, e, e);
		e += 4; //spacing
	}

	//top bottom orange strings
	var x1f = 200;
	var y1f = 0;
	var x2f = 200;
	var y2f = 300;
	for (var i = 0; i <= numLines2; i +=1) {
		stroke(255, 134, 4, 70);
		line(x1f, y1f, x2f, y2f);
		x1f += fx1;
		y1f += fy1;
		x2f += fx2;
		y2f += fy2;
	}

	//left right orange strings
	var x1g = 0;
	var y1g = 0;
	var x2g = 400;
	var y2g = 300;
	for (var i = 0; i <= numLines2; i +=1) {
		line(x1g, y1g, x2g, y2g);
		x1g += gx1;
		y1g += gy1;
		x2g += gx2;
		y2g += gy2;
	}

	noLoop();
}
LO 04 – Sound Art
Milkdrop is a visualizing plugin created by Google employee Ryan Geiss for Winamp, a media player for Windows systems. Milkdrop turns input audio such as songs or movies into abstract, constantly-changing psychedelic compositions. Since its release in 2001, Geiss has added extra features into the plugin, such as pixel shaders that allow for more complex and layered visualization presets.
Milkdrop takes the wavelength of an audio file playing in Winamp and analyzes it to create a visualization based on a preset, which is like a template for the program to convert the wavelength into a visual. Milkdrop uses a grid system on screen in which it calculates a pixel’s value based on a preset and interpolates the other pixels based on these values. In other words, it will calculate the values of about 32 x 24 evenly spaced points on the screen and averages the others based on the calculated values.
I was drawn to Milkdrop from how different it looked from other audio visualizers and how unlimited the potential for creating visualizations based in the program could be. I also found it interesting that Geiss’s skillset translated over to his work at Google, where he currently works on AI software for Pixel phones to help it take better photos.
Looking Outwards 04 – Sound Art
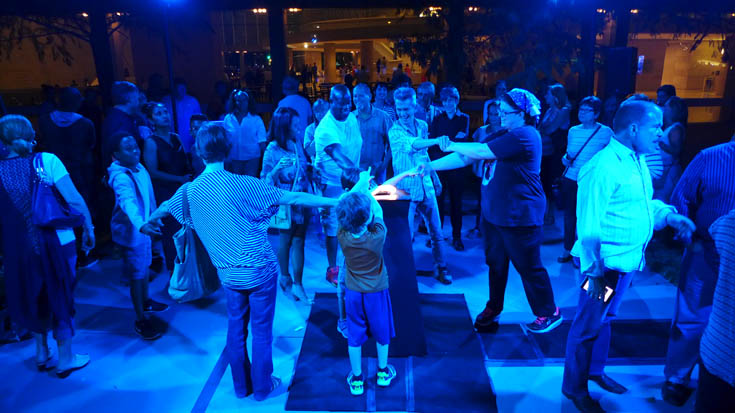
Urban Lights Contacts is an interactive sound and light installation by Scenocosme (Grégory Lasserre & Anaïs met den Ancxt). The installation is composed of a small interactive sphere. When a person puts his or her hand on the sphere, the body turns reactive and sensitive to other living bodies. When the person touching the sphere has a physical contact with another person, the installation starts emitting sounds. Each contact of each person generates varieties of different sounds. What this installation is doing is sensing the body’s electrostatic energy and emitting them as sounds. What’s interesting and unique about this installation is that it creates a sensory interactive experience with what we cannot detect in the eye. Encouraging people to have interactive contacts with other people they don’t know also gives a total unique experience. The interactive device generates a very sensitive approach of the body, recognizing different degrees of electrostatic contacts according to the proximates of living bodies. What I find interesting is that different people produce different electrostatic energy, which also makes the installation emit different sounds as well. The artists of this installation really focus on the interactive experience, an experience people cannot see but can hear and feel through the installation.
PROJECT 04- STRING ART
JUNE STRING ART
//junelee
//section c
//15-104
//junelee@andrew.cmu.edu

var incx1;
var incy1;
var incx2;
var incy2;
var linebw;
var offsetx;
var offsety;

function setup() {
    createCanvas(300,400);
    background(0);
}

function draw() {


//WHITE
//first- lines from 0,0
	// line(0,0,300,150);
	// line(75,0,300,300);

	strokeWeight(0.5);
	stroke(255);
	//increments for line
	linebw=30;

	incx1=(75-0)/linebw;
	incy1=0;
	incx2=0;
	incy2=(300-150)/linebw;

	//bound for starting line (box)
	var x1=0;
	var x2=300;
	var y1=0;
	var y2=150;

	//lines bw
	for (var n=0; n<=linebw; n+=1) {
		line(x1,y1,x2,y2);
		x1+=incx1;
		y1+=incy1;
		x2+=incx2;
		y2+=incy2;

	}
	noLoop();

//second- circles
	noFill();
	strokeWeight(0.7);
	stroke(255);
	//points
	var x1=125;
	var y1=200;
	linebw=30;

	//circle draw
	for (var diam=3; diam<=200; diam*=1.07) {
		circle(x1,y1,diam);
	}
	noLoop();

//third- background
	// line(100,400,300,150);
	// line(55,500,75,0);

	strokeWeight(0.5);
	stroke(255);

	//increments for line
	linebw=20;

	incx1=(300-75)/linebw;
	incy1=(150-0)/linebw;
	incx2=(100-55)/linebw;
	incy2=0;

	//bound for starting line (box)
	var x1=75
	var x2=55;
	var y1=-170;
	var y2=500;

	//lines bw
	for (var n=0; n<=linebw; n+=1) {
		line(x1,y1,x2,y2);
		x1+=incx1;
		y1+=incy1;
		x2+=incx2;
		y2+=incy2;
	}
	noLoop();


//BLUE
	translate(14,0)
		strokeWeight(0.5);
		stroke(0,0,255);
		//increments for line
		linebw=30;

		incx1=(75-0)/linebw;
		incy1=0;
		incx2=0;
		incy2=(300-150)/linebw;

		//bound for starting line (box)
		var x1=0;
		var x2=300;
		var y1=0;
		var y2=150;

		//lines bw
		for (var n=0; n<=linebw; n+=1) {
			line(x1,y1,x2,y2);
			x1+=incx1;
			y1+=incy1;
			x2+=incx2;
			y2+=incy2;

		}
		noLoop();

	//second- circles
		noFill();
		strokeWeight(0.7);
		stroke(0,0,255);
		//points
		var x1=125;
		var y1=200;
		linebw=30;

		//circle draw
		for (var diam=3; diam<=200; diam*=1.07) {
			circle(x1,y1,diam);
		}
		noLoop();

	//third- background
		// line(100,400,300,150);
		// line(55,500,75,0);

		strokeWeight(0.5);
		stroke(0,0,255);

		//increments for line
		linebw=20;

		incx1=(300-75)/linebw;
		incy1=(150-0)/linebw;
		incx2=(100-55)/linebw;
		incy2=0;

		//bound for starting line (box)
		var x1=75
		var x2=55;
		var y1=-170;
		var y2=500;

		//lines bw
		for (var n=0; n<=linebw; n+=1) {
			line(x1,y1,x2,y2);
			x1+=incx1;
			y1+=incy1;
			x2+=incx2;
			y2+=incy2;
		}
		noLoop();


//RED
	translate(20,0)
		strokeWeight(0.5);
		stroke(255,0,0);
		//increments for line
		linebw=30;

		incx1=(75-0)/linebw;
		incy1=0;
		incx2=0;
		incy2=(300-150)/linebw;

		//bound for starting line (box)
		var x1=0;
		var x2=300;
		var y1=0;
		var y2=150;

		//lines bw
		for (var n=0; n<=linebw; n+=1) {
			line(x1,y1,x2,y2);
			x1+=incx1;
			y1+=incy1;
			x2+=incx2;
			y2+=incy2;

		}
		noLoop();

	//second- circles
		noFill();
		strokeWeight(0.7);
		stroke(255,0,0);
		//points
		var x1=125;
		var y1=200;
		linebw=30;

		//circle draw
		for (var diam=3; diam<=200; diam*=1.07) {
			circle(x1,y1,diam);
		}
		noLoop();

	//third- background
		// line(100,400,300,150);
		// line(55,500,75,0);

		strokeWeight(0.5);
		stroke(255,0,0);

		//increments for line
		linebw=20;

		incx1=(300-75)/linebw;
		incy1=(150-0)/linebw;
		incx2=(100-55)/linebw;
		incy2=0;

		//bound for starting line (box)
		var x1=75
		var x2=55;
		var y1=-170;
		var y2=500;

		//lines bw
		for (var n=0; n<=linebw; n+=1) {
			line(x1,y1,x2,y2);
			x1+=incx1;
			y1+=incy1;
			x2+=incx2;
			y2+=incy2;
		}
		noLoop();

}
I chose to portray string art that interacts with each other and creates new shapes through intersections. I chose the colors for a “trippy” color palette.