![[OLD FALL 2020] 15-104 • Introduction to Computing for Creative Practice](../../../../wp-content/uploads/2021/09/stop-banner.png)
PENNY
By Stamen Design
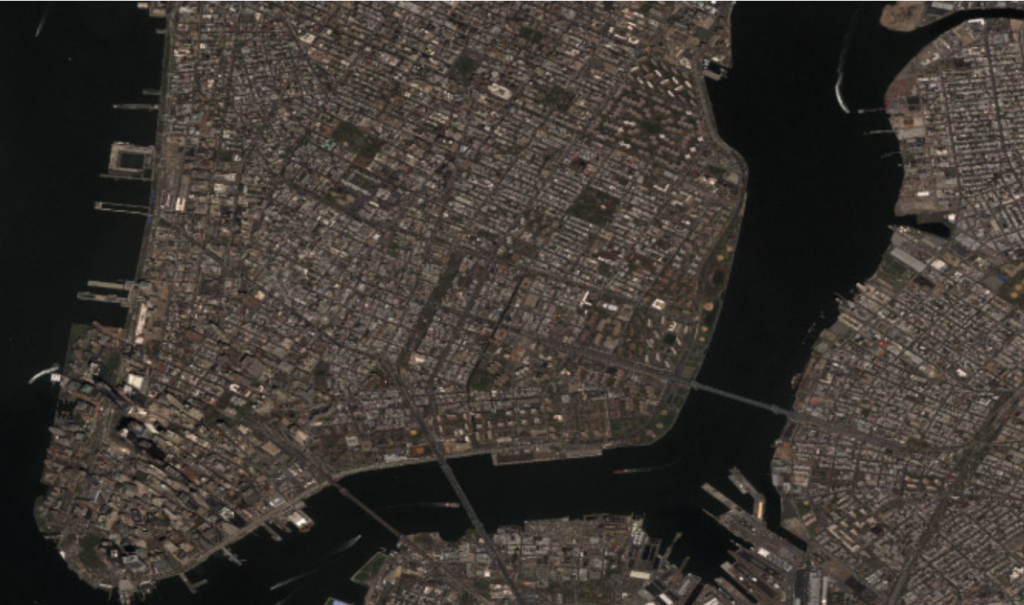
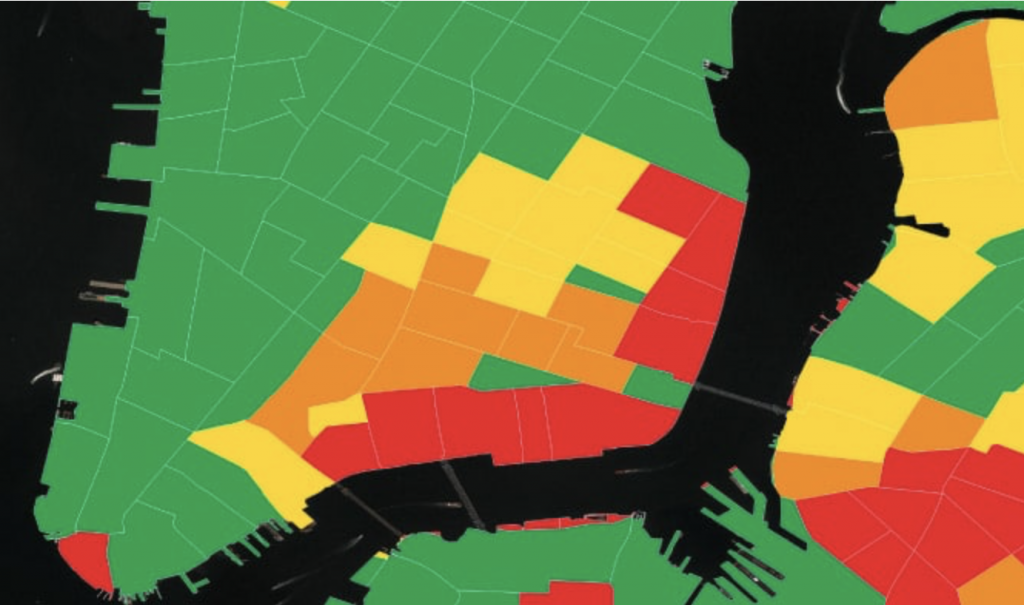
Today, I will be talking about an AI Project called Penny done by Stamen Design. This simple tool is designed to help understand what wealth and poverty look like to a artificial intelligence built on machine learning using neural networks. Penny is built using income data from the U.S. Census Bureau, overlaid on DigitalGlobe satellite imagery. This information was then given to a neural network. Trained to predict the average household incomes in any area in the city using data from the census and the satellite. The AI looks for patterns in the imagery that correlate with the census data, and over time, users are able to ask the model what it thinks income levels are for a place just from a satellite image. This project is really interesting to me because this visualization and AI can be used to improve the quality of life, and physically see the imbalances within a neighborhood for better wealth distribution.
View project here