![[OLD FALL 2020] 15-104 • Introduction to Computing for Creative Practice](https://courses.ideate.cmu.edu/15-104/f2020/wp-content/uploads/2021/09/stop-banner.png)
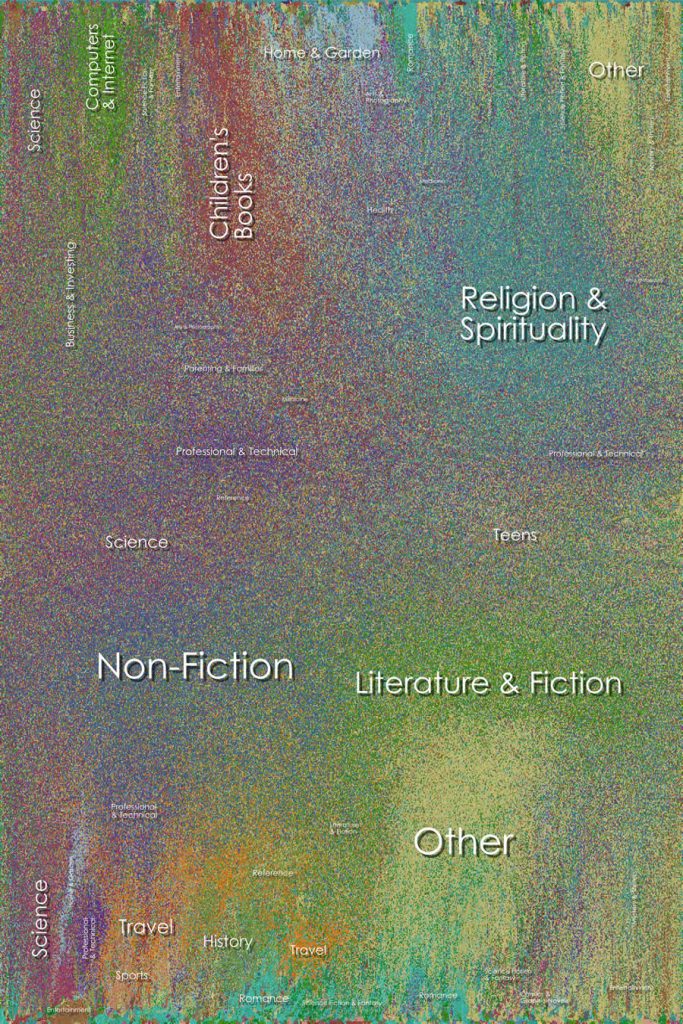
This week, I decided to look at Chris Harrison’s Amazon Book Map He looked at 735,323 books and captured similarity data between them based on what Amazon recommended. He then color coded them depending on genre and created a visualization of his findings. I really admire the effort he put into it and the way it all came together in a mosaic like pattern. The algorithms he used created the layout and clustering but he noted that his algorithm didn’t work well for unstructured graphs. Harrison has created a lot of these visualizations and is trying to look at a new way to display data, and I think he was very successful with this. Especially color coding, it allows the user to see how different genres mesh together in a more user-friendly way.