![[OLD FALL 2020] 15-104 • Introduction to Computing for Creative Practice](https://courses.ideate.cmu.edu/15-104/f2020/wp-content/uploads/2021/09/stop-banner.png)
Facebook Stories: Virality by Rachel Binx
https://rachelbinx.com/Facebook-Stories-Virality
jwesthei, Section B
This project is a play on the concept of going “viral” and how this can be visualized. Aesthetically very similar to the “Self-Dividing Line” project I reviewed last week, this one visualizes how one a piece of media (in this case three of the most shared images on Facebook) ends up being shared hundreds of thousands of times on a social media platform.
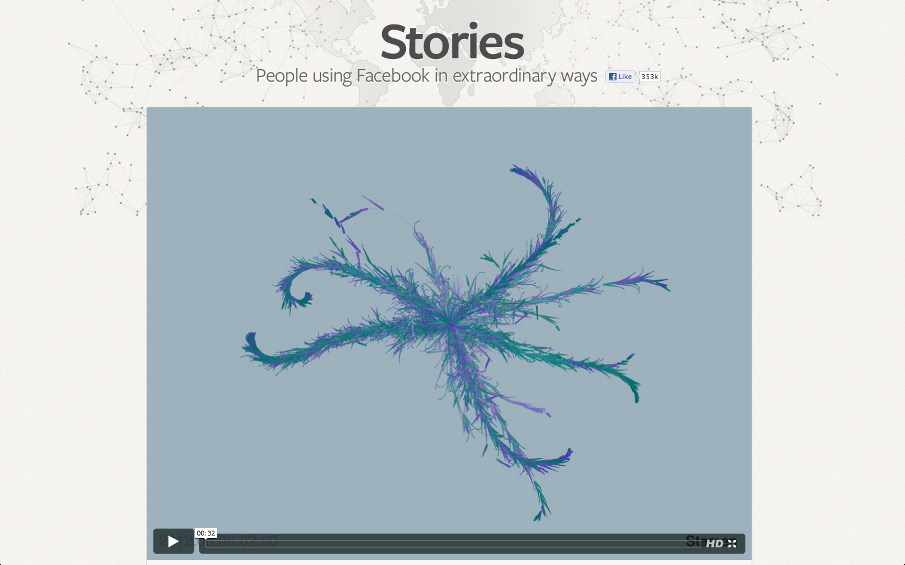
The pieces start as a single person and split off into branches as the media is shared. As the piece becomes shared and re-shared, the project visualizes the gender of the person sharing it as well as the relative age of the share as time progresses. The artist worked with Zach Watson to create the algorithm using the WebGL framework and animate this. I could not find a lot of information about the specifics of the algorithm used, but I would imagine it is similar to that of the “Self-Dividing Line,” where instead of randomly generated midpoints to split from, the time and number of branches come from actual data defining a shared media.