//Aadya Bhartia
//Section A
//abhartia@cmu.edu
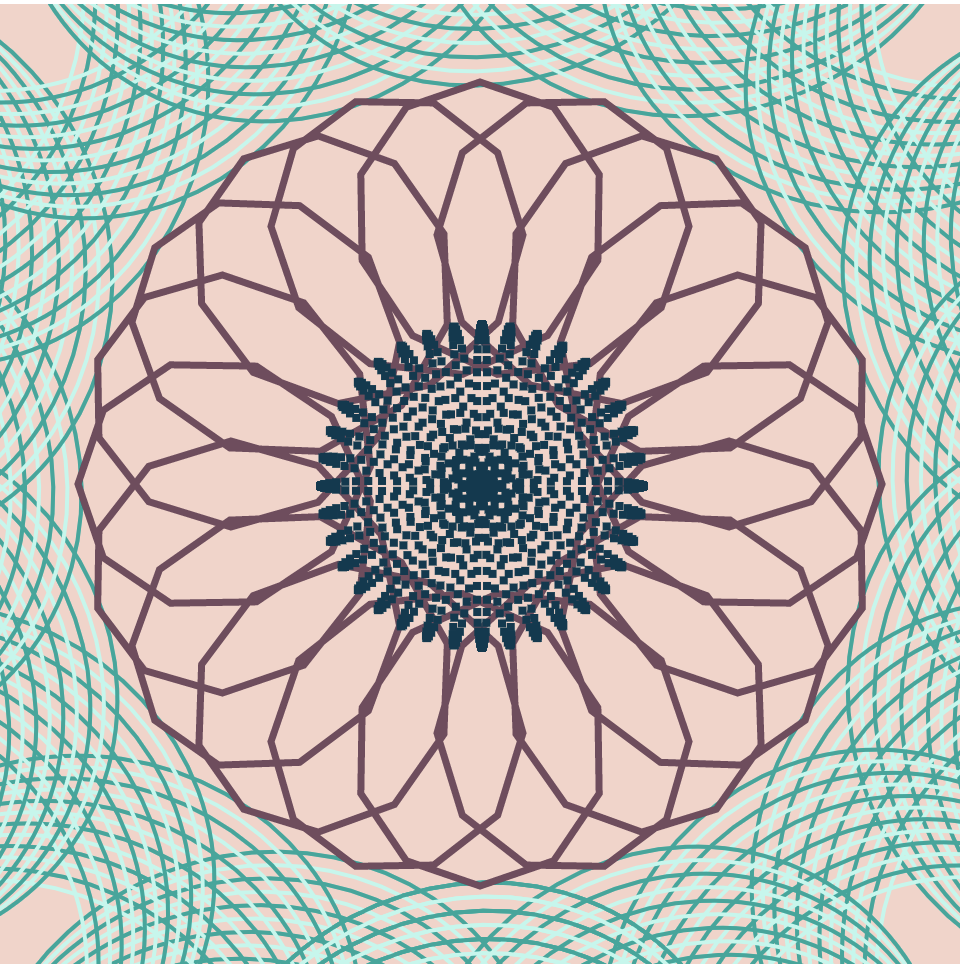
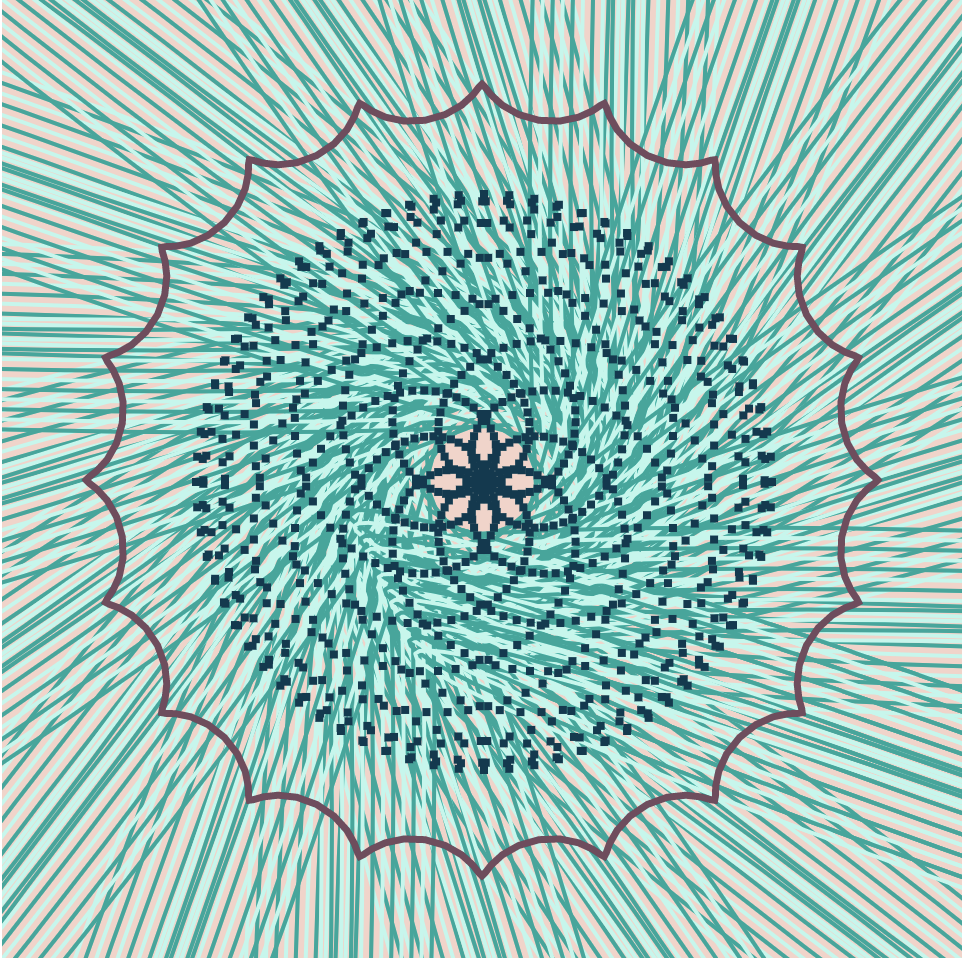
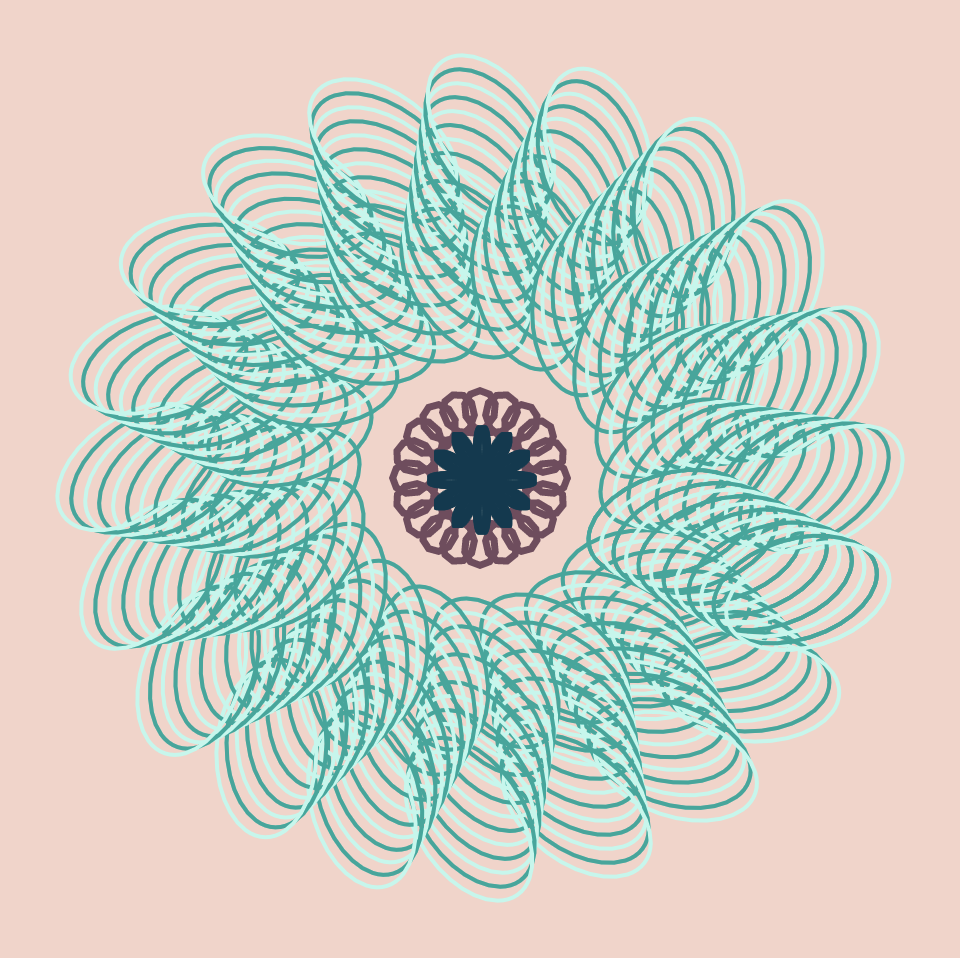
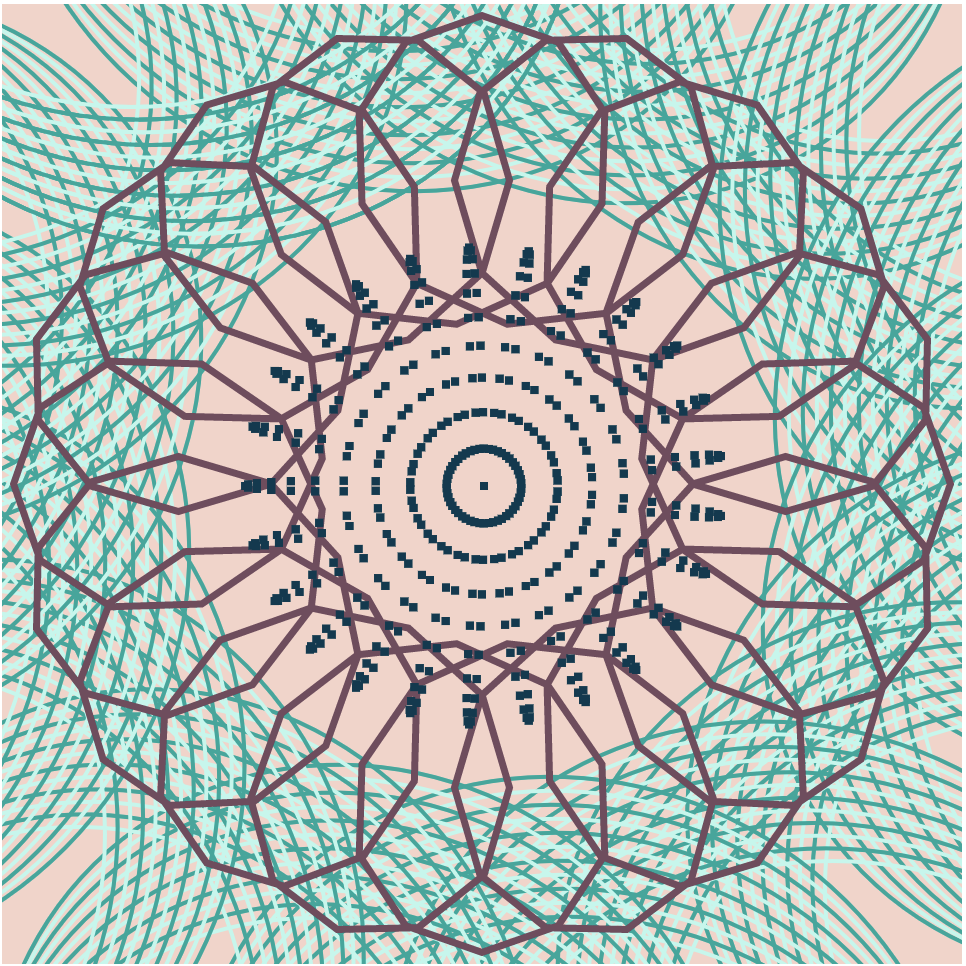
/*The code aims to use three main types of curves and modify them based on the X and Y position the mouse
Each set of curves are represented in different ways making the code more visually interesting */
var angle = 0;
var numP = 10000;
function setup() {
createCanvas(480, 480);
}
function draw() {
background(245, 211, 200);
var midX = width/2;
var midY = height/2;
var currentX = constrain(mouseX, 0, midX);
var currentY = constrain(mouseY, 0, midY);
noFill();
translate(midX, midY); //transa;lting origin to centre of canvas
var m = map(constrain(mouseX, 0, width), 0, width, 0,width/60);
push();
rotate(radians(angle));
angle +=mouseY/4; // making the set of curves rotate based on mouse position
drawHypotrochoid1(currentX,currentY);
pop();
drawHypotrochoid2();
drawRose(m);
}
//Rose rhodonea curve set mapped with rectangles
function drawRose(m){
fill(2, 58, 80); //dark blue
noStroke();
var roseW = 18;
for(var i = 0; i < numP/10;i++){ // reducing density of points
var roseMap = map(i, 0, numP/10, 0, TWO_PI);
//The design chnages based on MouseX
var n = int(map(mouseX, 0, width, 1, width/15));
var radius = -m*cos(n*roseMap);
var x = roseW*radius*cos(roseMap);
var y = roseW*radius*sin(roseMap);
rect(x-1,y-1,4,4); // makinf the shape out of smaller rectangles instead of curves
}
}
// Hypotrochoid curve set 1
function drawHypotrochoid1(currentX,currentY){
var a = 5;
for(var k = 0;k<=PI*2;k+= PI/10){
for(var i = 0; i<width/40;i++){
push();
strokeWeight(2);
//every alternate stroke uses a different shade of blue
if(i%2 == 0){
stroke(3, 168, 155);
}
else{
stroke(188, 248, 236 );
}
rotate(k);
ellipse(currentX + a*i, currentY + a*i, 2*mouseX/2, 2*mouseY/2);
pop();
}
}
}
// Hypotrochoid curve set 2
function drawHypotrochoid2(){
stroke(115, 75, 94); //maroon
noFill();
strokeWeight(3.5);
var hypoMapY = map(mouseY, 0 , height, 0, width/4); //curve shape evolves based on Mouse Y
//Mouse X controls the size of the curve
var a = map(constrain(mouseX,0,width), 0 , width , 0, width/2);
var b = a/20;
beginShape();
for(var i = 0; i<numP; i++){
var hypoMap = map(i,0,100,0,PI);
var x = (a - b) * cos(hypoMap)+ hypoMapY* cos(((a-b)/b)*hypoMap);
var y = (a-b) * sin(hypoMap) - hypoMapY * sin(((a - b)/b)*hypoMap);
vertex(x,y);
}
endShape();
}
![[OLD FALL 2020] 15-104 • Introduction to Computing for Creative Practice](https://courses.ideate.cmu.edu/15-104/f2020/wp-content/uploads/2021/09/stop-banner.png)