![[OLD FALL 2020] 15-104 • Introduction to Computing for Creative Practice](https://courses.ideate.cmu.edu/15-104/f2020/wp-content/uploads/2021/09/stop-banner.png)
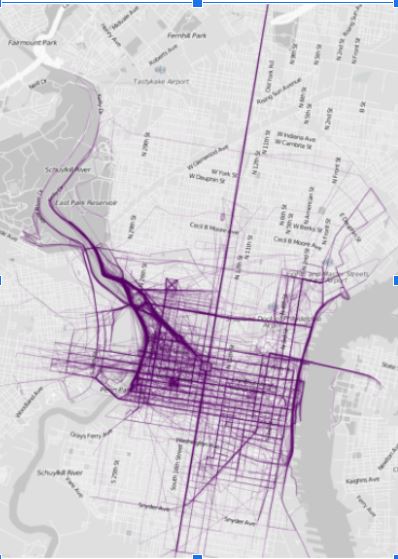
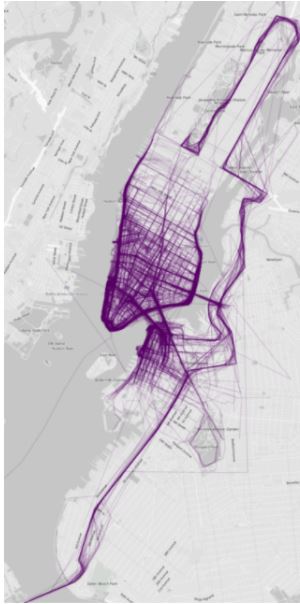
Nathan Yau is using data from the running app RunKeeper to create visualizations of the most taken courses or paths runners take in different cities. Nathan is a statistician from FlowingData who focuses on information design, as seen in the informational maps he has created below. He finds that visualization is a key way to make data more accessible and attractive.
He created these data visualizations for 18 major US cities, including Chicago, LA, and New York City. He simply concluded that most runners love to run near nature, which are near water and parks.
To create these visualizations he may have used photoshop to collage all the paths of every runner or maybe if he used p5js he created arrays that marked each location as a point and when each location is marked the density increases, which increases the deepness of the purple as well.