Final Project

The project is representing two events we had to deal with in 2020, the so-called Asian murder hornets and the coronavirus.
The project is a game that mimics arcade-style 2D shooter games.
The player is a hornet facing off against cells of the coronavirus and taking them down with glowing green bullets.
Whenever a virus reaches the bottom of the screen, the player loses.

While developing this project, I came across a lot of problems , the most complicated being the interaction between the bullet and virus.
I was not sure how to call a property of an object in an array while comparing it to another property of an object in another array and then making something happen with it.
However, I ended up using a nested for loop to linear search both the virus and bullet and using a conditional to check if the x and y value of those searched are matching.

Creating a project for myself and implementing the coding strategies I’ve learned over this semester definitely cemented what I’ve learned and see the usage of these techniques in my own way.
Overall, I learned about my strength and weaknesses when tackling a coding project through this experience.

sketch

var movement = []
var bullets = [];
var xpos;
var ypos;
var cv;
var score;
var c=0
var virus = [];
var cvimage = [];
var cvlinks = [
"https://i.imgur.com/Nw3KzRI.png", // virus images
"https://i.imgur.com/JlYsbHq.png",
"https://i.imgur.com/rIXhNzt.png",
"https://i.imgur.com/SjJmecC.png"
]
var count = 0;

function preload(){
  for (var i = 0; i<4; i++){ // loading images into array
    cvimage[i] = loadImage(cvlinks[i]);
  }
  hornet = loadImage("https://i.imgur.com/tU0dXCU.png")
  hornetshadow = loadImage("https://i.imgur.com/JErLPWR.png")
}
function setup() {
    createCanvas(500, 500);
    for (var i = 0; i < 100; i++){ // initial background lines
        var rx = random(width);
        var ry = random(height);
        movement[i] = makemovement(rx,ry);
    }
}
function draw() {
    background(255)
    startgame();
    updatemovement();
    removemovement();
    addmovement();
    updatevirus();
    addvirus();
    removevirus();
    drawhornet();
    updateremovebullet();
    bulletvirusinteraction();
    lose();
    count++
}

function startgame(){ // openning of game
  push()
  translate(width/2,height/2)
  fill(0)
  scale(c)
  circle(0,0,5)
  c+=2
  pop()
}
// BACKGROUND MOVEMENT
function updatemovement(){
    for (var i = 0; i < movement.length; i++){ //background lines appearing and moving
        movement[i].move(); //moving
        movement[i].display(); // appearing
    }
}
function removemovement(){
    var movementtokeep = []; // array to keep existing lines
    for (var i = 0; i < movement.length; i++){ //going through lines to see which to keep
        if (movement[i].y + 100 < 500) {
            movementtokeep.push(movement[i]);
        }
    }
    movement = movementtokeep; //return kept lines back inot movement array
}
function addmovement() {
      for (var i = 0; i < 100; i++){ // adding more background lines
          var rx = random(width);
          var ry = random(height);
          movement.push(makemovement(0))
          movement[i] = makemovement(rx,ry);
      }
}
function mvmtMove() {
    this.y += this.speed; // lines movement down canvas
}
function mvmtDisplay() { // white lines
    stroke(255);
    line(this.x,this.y,this.x,this.y+100);
}
function makemovement(startx,starty) { //properties of background object
    var mvmt = {x: startx,
                y: starty,
                speed: 1,
                move: mvmtMove,
                display: mvmtDisplay}
    return mvmt;
}
function drawhornet(){
    xpos=constrain(mouseX,0,width-50); // keep hornet in canvas
    ypos=map(mouseY,0,height,350,450);// keep hornet in bottom portion of the canvas
    image(hornet,xpos,ypos,50,50); // draw hornet
}

// VIRUS

function updatevirus(){
    for (var i = 0; i < virus.length; i++){ // showing and mocing viruses
        virus[i].move();
        virus[i].display();
    }
}
function addvirus() { // creating a new row of virus
    if (count % 100 == 0){
      for (var i = 0; i < 4; i++){
          virus.push(makecv(int(random(10))*50)); // x position of virus is at mulitples of 50
      }
    }
}
function removevirus(){ // if virus is less than height of canvas the virus is kept
    var viruskeep = [];
    for (var i = 0; i < virus.length; i++){
        if (virus[i].y < height) {
            viruskeep.push(virus[i]);
        }
    }
    virus=viruskeep
}
function makecv(startx) { // object propeties of virus with x value being varied from loop from before
    var virus = {x:startx,
                y: -100,
                speed:.5,
                img: random(cvimage),
                move: virusmove,
                display: virusdisplay}
    return virus;
}
function virusmove() { // virus movement
    this.y += this.speed;
}
function virusdisplay() {// show virus
    image(this.img,this.x,this.y,50,50);
}

//BULLET

function mousePressed(){ // when mouse is pressed a new bullet is generated
      var startingbullet = makebullet(xpos, ypos);
      bullets.push(startingbullet);
}
function updateremovebullet(){ //move and show bullet while keeping if under 150 counts to keep array short
  newbullets = [];
  for (var i = 0; i < bullets.length; i++) {
      var b = bullets[i];
      b.stepFunction();
      b.drawFunction();
      if (b.age < 150) {
          newbullets.push(b);
      }
  }
  bullets = newbullets; // kept bullets back into bullets array
}
function bulletmove() { // bullet movement
    this.y -= this.dy;
    this.age ++
  }
function bulletdisplay() { // glowing green bullets
    fill(0,200,0)
    ellipse(this.x,this.y,10)
    fill(0,255,0)
    ellipse(this.x,this.y,5)
}
function makebullet(bulletx, bullety) { // bullet object properties
    b = {x: bulletx,
         y: bullety,
         dy: 4,
         age: 0,
         stepFunction: bulletmove,
         drawFunction: bulletdisplay
        }
    return b;
}
function bulletvirusinteraction (){
  for (var i= virus.length-1;i >0; i--) { // linear search virus backwards so when spliced it doesnt skip one
    for (var j= bullets.length-1;j >0; j--) { // linear search bullets
      if ((bullets[j].x <= virus[i].x+50) // range of bullet and virus x values must match
        & (bullets[j].x >= virus[i].x-50)
        && (bullets[j].y <= virus[i].y+25)){ // range of bullet and virus y values must match
      virus.splice(i,1); //if they match then both bullet and virus disappear from the array
      bullets.splice(j,1);
      }
    }
  }
}
function lose (){
    for (var i= 0 ;i < virus.length; i++) {
      if ( virus[i].y==450){ // if any virus' y value passes 450 then player loses
        gameover(); // trigger gameover screen
      }
    }
}
function gameover (){
  fill(255,0,0);
  rect(0,0,500,500);
  noStroke();
  fill(0);
  textSize(50);
  text('GAME OVER',100, height/2);
  textSize(20);
  frameRate(0); // end frame
}

LookingOutwards-11

Angela Washko is an artist specialized in games and experiential art. She pushes for conversation and development of feminism and challenges societal norms. Angela does this through her own mediums video games and the world of gamers. She facilitates The Council on Gender Sensitivity and Behavioral Awareness in World of Warcraft, proving that females can be gamers too.

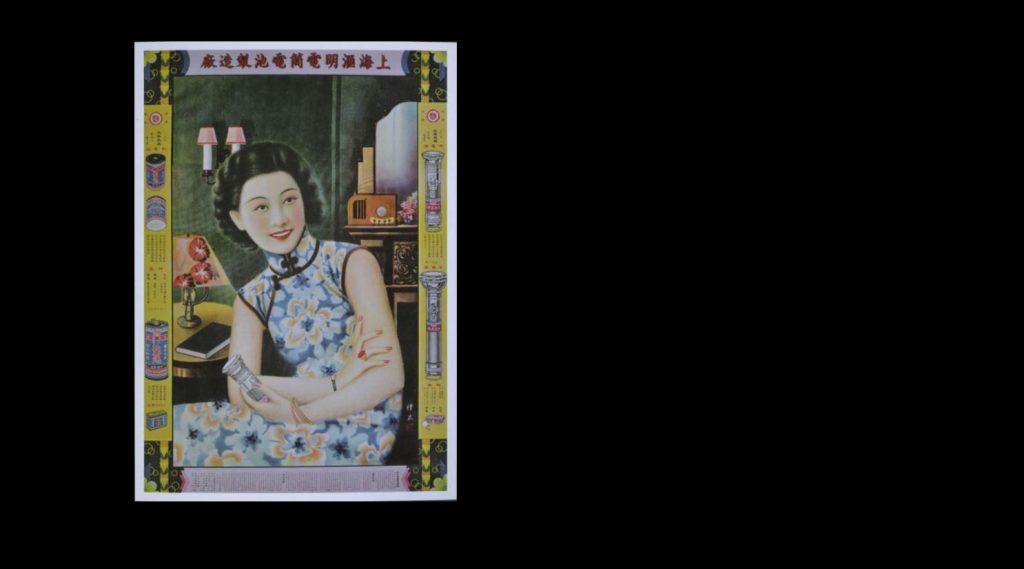
She is currently a tenure-track Assistant Professor of Art at our school, Carnegie Mellon University, and is a core faculty member for the MFA program. Her most popular work is arguably The Game: The Game. However, another interesting project is “Woman as Place”. It is an interactive game where she displays postcards from different regions of the world. It is a straightforward game with a straightforward concept, but the display and unique method of showing off her collection of postcards are enrapturing.

Play the game here.

Starting screen
Transition screen
Example of a post card in a region

Project-10-Sonic-Story

I was browsing on freesound.org and found the splash sound that I thought was pretty versatile in terms of story telling and after I picked out a few more sounds I cam up with the story of watching a man skydive into the ocean.

sketch>

// Xander Fann xmf Section B
// it is a nice day out as a plane is flying into the air. You feel the size and heft of the play as it flys by. A man sky dives from that plane into the ocean.
var count = 0;
var airplanex = 0;
var airplaney = 100;
var airplanebx = 500;

var noiseParam = 0;
var noiseStep = .03;
var y = 0;
var wy = 250;

function preload() {
    //images
    airplane = loadImage("https://i.imgur.com/bnGrcCO.png")
    airplanebelly = loadImage("https://i.imgur.com/g6yOr9u.png")
    pman = loadImage("https://i.imgur.com/IQzArq5.png")
    ocean = loadImage("https://i.imgur.com/PZiDoUi.png")

    //sounds
    planeengine = loadSound("http://courses.ideate.cmu.edu/15-104/f2020/wp-content/uploads/2020/11/airplane-flying.wav")
    door = loadSound("http://courses.ideate.cmu.edu/15-104/f2020/wp-content/uploads/2020/11/creaking-door-04.wav")
    falling = loadSound("http://courses.ideate.cmu.edu/15-104/f2020/wp-content/uploads/2020/11/falling.wav")
    splash = loadSound("http://courses.ideate.cmu.edu/15-104/f2020/wp-content/uploads/2020/11/_splash-jumnping-a.wav")
}
function setup() {
    createCanvas(400, 200);
    frameRate(20);
    useSound();
}
function soundSetup() {
    planeengine.setVolume(.4);
    door.setVolume(.4);
    splash.setVolume(.5);
    falling.setVolume(.5);
    planeengine.play();
}

function draw() {
    print(count)
    background(200,250,255); //sky
    count++;
    if (count >= 0){
        image(airplane,airplanex,airplaney,100,100);
        airplanex+=3;
        airplaney-=1;
        noStroke();
        for (opac = 50; opac>0; opac-=5){ // sun opacity ot create gradient
            for (dia = 100; dia < 200; dia+=10){ // expanding diameter
                fill(255,255,200,opac);
                ellipse(0,0,dia,dia);
            }
        }
    }
    if (airplanex >= width){
        background(200,250,255);
        image(airplanebelly,airplanebx,-270,500,500); // bottom of big plane
        airplanebx-=3;
        planeengine.play();
     }
     if(count=460){ // door opens
         door.play();
     }
     if(count=500){ // starts falling
         falling.play();
     }
     if(count=500){ // hits water
         splash.play();
     }
     if (count>=475&count<=650){ // man falls and water comes up
         planeengine.stop();
         var n = noise(noiseParam);
         var x = map(n,0,1,0,width/2);
         noiseParam+=noiseStep;
         image(pman,x,y,70,70); //parachute man
         y++;
         image(ocean,0,wy,400,200);
         wy-=1;
     }
     else if (count==650) { // ned
         background(0);
          falling.stop();
          splash.stop();
          noLoop();
     }
}

Looking Outwards 10: Computer Music

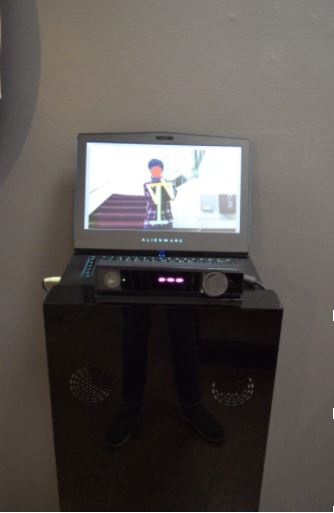
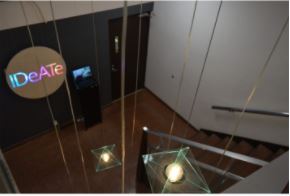
The staircase to the staircase from the ground floor to the basement of Hunt Library here at Carnegie Mellon University has an installation designed to be interactive between those who use the stairwell. The light installation creates a noise with different frequencies and tones based on the location of the person. Then, in the end, there is a chime to signify a goal met.

This project is taking an everyday task and filling it with fun and excitement. The student secured permission to place the installation and started working on how to track movement. He was able to use the OpenPose library from the CMU Perceptual Computing lab and the Unity 3D game engine to find positions. I admired how the developer had an idea and kept working at it and acknowledged that it is not complete. He batted with a lot of creative choices like whether he wanted it to be noticeably interactive or a hidden display.

The code and more information can be found here.

Stairs Of Hunt Library

Project-09-Portrait

sketch

var img;
var x = [42,25,73,15,72,43,65]
var y = [42,63,43,83,87,47,17]
var move = 15

function preload(){
    img = loadImage("https://i.imgur.com/EwNcUnYm.jpg")
}
function setup() {
    createCanvas(480, 480);
    background(255);
    noStroke();
    img.resize(480,480)
    imageMode(CENTER)
    x = img.width/2 // middle of image
    y = img.height/2
}

function draw() {
    imgpixel = img.get(x,y) // retrieve pixel color
    fill(imgpixel); // fill shape with color of pixel
    square(x,y,15)
    x+=random(-move,move) // random walk
    y+=random(-move,move)
    constrain(x,0,img.width);// left and right constrain
    constrain(y,0,img.height);// top and bottom constrain
}

Instead of creating the portrait from random pixels, it is created by using the random walk where the portrait is drawn by a wandering object. If someone wants a more precise and accurate image they can adjust the size of the object.

After the object has wandered for a while

Looking Outwards 09: on Looking Outwards

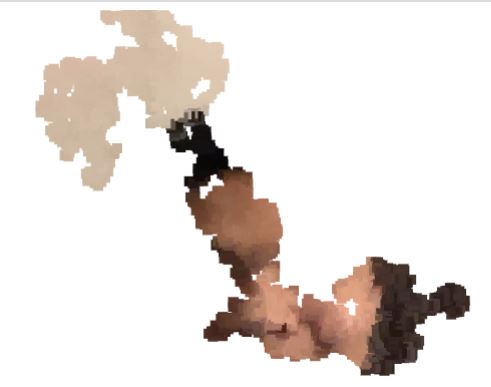
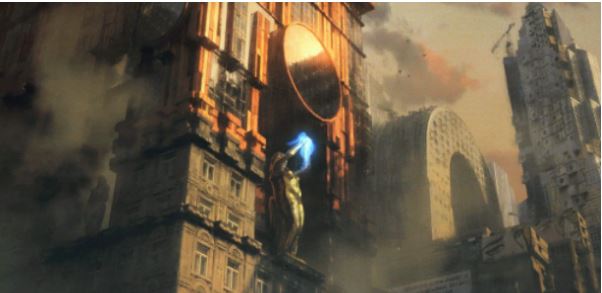
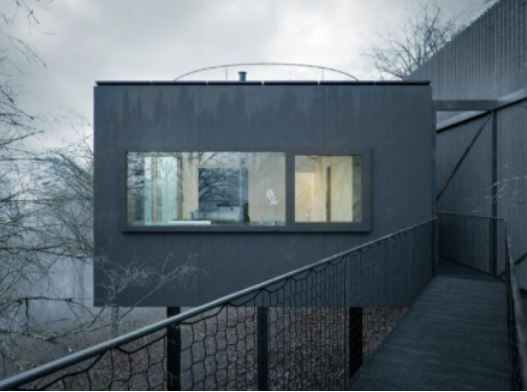
In the 5th week of looking outwards, we were tasked with looking at 3d graphics. There is a wide variety of choices my classmates have chosen to analyze and elaborate on. A specific one I’ve taken a liking to is the one on Jakub Javora by the author under the alias, rkim. They bring up the transformation of a real location to an alternate reality in a project called Restore Point. This is similar to the post by the author under the alias, carson michaelis. The core concept of creating an illusion with a preexisting condition is what the authors and I find fascinating. They focused on a rendering from an architectural firm, WOJR, and their project, ‘Mask House’.The difference between the two projects is one is creating an artificial world that is meant to be fantasy but one is created to portray a potential reality. Both create a mood they want the viewer to experience and cater to their visual palette. I enjoyed both projects and think both authors are absolutely right when it comes to their analysis of their executions.

rkim’s Looking Outwards 5
carson michaelis Looking Outwards 5

LookingOutwards-08

Nathan Yau was who I wrote about in my last Looking Outwards and he spoke in the 2019 Eyeo where he elaborates on his design journey. He specializes in creating data visualizations that are easy to read and concise. He created the website Flowingdata.com where he creates data visualizations for himself and others. He is also the author of both Data Points: Visualization That Means Something and Visualize This: The FlowingData Guide to Design, Visualization, and Statistics. Essentially he wants to make data more accessible and easier to read to everyday people.

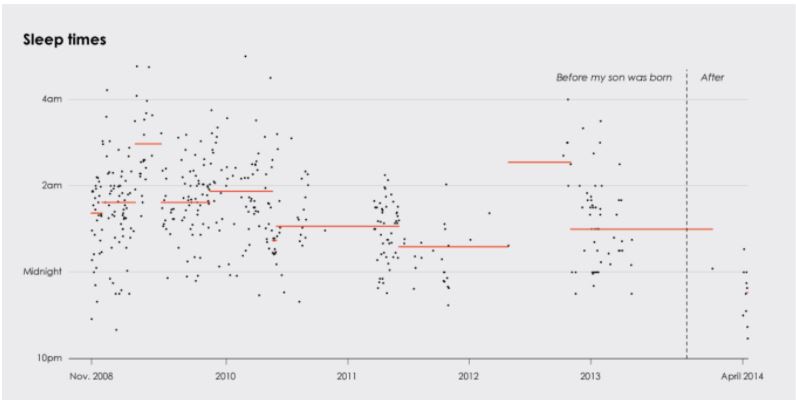
What I admire is that he is a designer for the people. Nathan designs with the idea that data is only effective if it is able to get the message across without boring or confusing the reader. He even creates visual representations of his own personal life that other people may not be interested in. He creates them for himself, where he can see the relationships between data only he finds relevant. He mentions that he recently has a child and made a chart about when he sleeps. He is able to easily analyze and interpret all this information because of his visualization skills. He talks about his approach to data visualizations in a comedic and sentimental way and relating how he found his passion for his growth. His explanation and story reinforce the idea of simple yet developed data visualizations.

When Nathan Yau sleeps over the years

Project-07-Curves

This is based on a hypotrochoid, which is a point rotating around a circle that is rotating around a larger circle. The point is supposed to create a looping pattern around the larger circle. I changed this by having the position of the mouse affect how fast the point would rotate, breaking the looping pattern created by a hypotrochoid. In addition, I also had the mouse affect the speed at which the inner circle was rotating around the outer circle and the distance the point is from the inner circle. It is a little activity where you can try to fill in the backgroudn with the blue but it is challenging because the point in always rotating and affected by the mouse position.

sketch

var r = 0 // rotation angle of outer circle
var r1 = 0 // rotation angle for inner circle
function setup() {
    createCanvas(480, 480);
    background(0);
    strokeWeight(0);
}

function draw() {
    fill(255);
    textSize(20);
    text('Fill in the background!',0,20);
    translate(width/2,height/2);
    scale(.8);
    speedr = map(mouseX,0,480,0,3,true);
    rotate(radians(r));
    r += speedr
    outercircle();
    innercircle();

    function innercircle(){
      push();
      fill(0,255,0);
      translate(0,170);
      speedr1 = map(mouseY,0,480,1,5,true);
      rotate(radians(r1));
      r1 += speedr1
      circle(0,0,60);
      point();
      pop();

      function point(){
        fill(0,0,255);
        cdistance = map(mouseX,0,480,20,150);
        circle(0,cdistance,30);
      }
    }
    function outercircle(){
      fill(255,0,0);
      circle(0,0,400);
    }
}

Looking Outwards-07

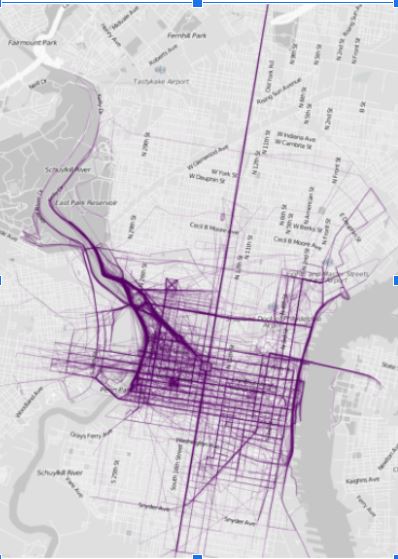
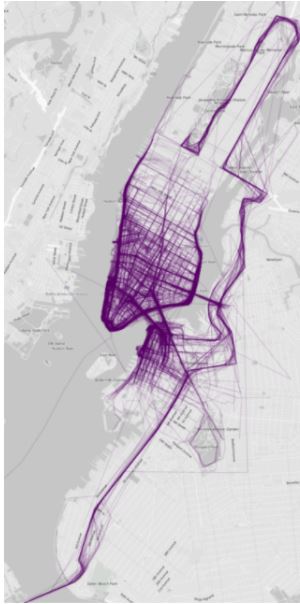
Nathan Yau is using data from the running app RunKeeper to create visualizations of the most taken courses or paths runners take in different cities. Nathan is a statistician from FlowingData who focuses on information design, as seen in the informational maps he has created below. He finds that visualization is a key way to make data more accessible and attractive. 

He created these data visualizations for 18 major US cities, including Chicago, LA, and New York City. He simply concluded that most runners love to run near nature, which are near water and parks.

To create these visualizations he may have used photoshop to collage all the paths of every runner or maybe if he used p5js he created arrays that marked each location as a point and when each location is marked the density increases, which increases the deepness of the purple as well.

Philadelphia running paths
New York City running paths

Project-06-Abstract-Clock

sketch

  // Xander Fann xmf Section B

function setup() {
    createCanvas(600, 600);
    background(220);
}

function draw() {
    var s = second()*10;
    var m = minute()*10;
    var h = hour()/2;
    background(190, 210, 255);//sky
    noStroke()
    //human
    push();
    translate(m,0)
    fill(0)
    circle(0,390,20) //head
    ellipse(0,430,30,50) // body
    pop();
    //sun
    fill(255,255,0,150); // yellow, lowered opacity
    circle(width/2,height/2,h*30);
    if (h>= 12) {circle(width/2,height/2,h/30); //when past 12 the sun shrinks
    }
    //cloud
    push();
    translate(s,0);
    for(x = 25;x<=145;x+=40){ // three clouds changing arch height and opacity
      fill(255,255,255,x/1.5);arc(x,200,200,x*1.5,PI,0)
    }
    pop();
    //bridge and ground
    fill(142, 224, 137);
    stroke(176, 147, 91);
    strokeWeight(7);
    line(0,450,600,450);
    noStroke();
    arc(0,height,400,300,PI,0);//ground
    arc(width,height,400,300,PI,0);

}

Back then the daylight outdoors was the only way to tell when it was time to work or sleep. My abstract clock is determined by the movement of the sky, the movement of the human doing work and the size of the sun. The sun is getting larger as time increases towards the day and the man will always be moving to do work.