![[OLD FALL 2020] 15-104 • Introduction to Computing for Creative Practice](../../../../wp-content/uploads/2021/09/stop-banner.png)
Bible Cross References by Chris Harrison, 2007
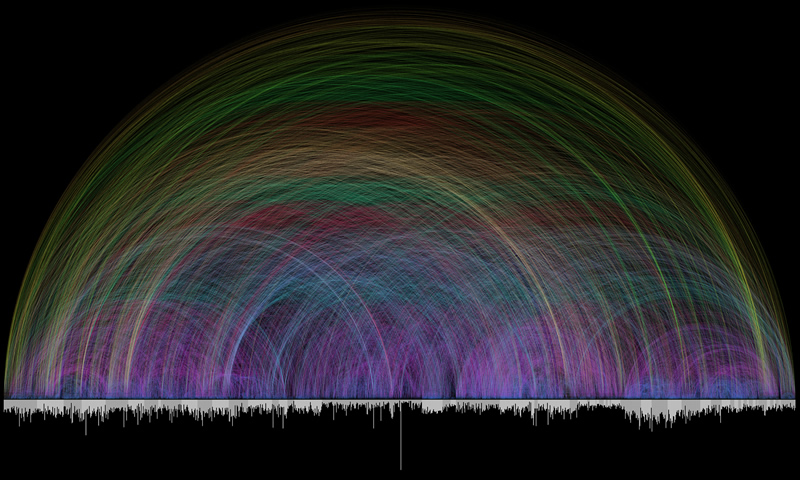
This data visualization was a collaboration between Chris Harrison and Christoph Römhild. The data visualization depicts all of the cross-references in the Bible. There were over 63,000 cross references in total, and the challenge was to visualize this large amount of information in an elegant way. The bar graph at the bottom of the visualization represents all the chapters in the Bible. The length of each bar depicts the length of each chapter. Each cross reference is depicted by an arc, and the color of each arc corresponds to the stance of the cross reference between the chapters.
I admire the visual aspect of the data visualization. The data visualization was made so it resembles a rainbow, which also has symbolic meaning in the famous story from the Bible, “Noah’s Ark.” The connection between the Bible and data visualization was very interesting and relevant to the information Harrison was displaying.
I’m now sure about the algorithms that generated the work, but I think Harrison used an algorithm that was able to find cross references in the Bible, and compute its distance across chapters. Then, he would change the colors of the arcs based on the distance.