![[OLD FALL 2020] 15-104 • Introduction to Computing for Creative Practice](../../../../wp-content/uploads/2021/09/stop-banner.png)
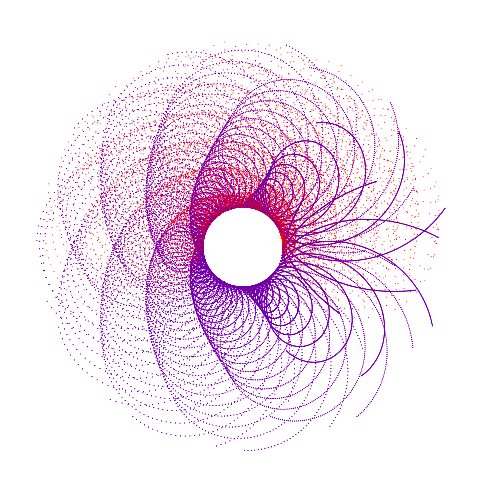
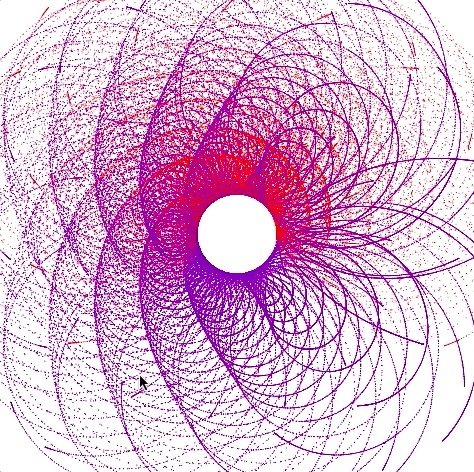
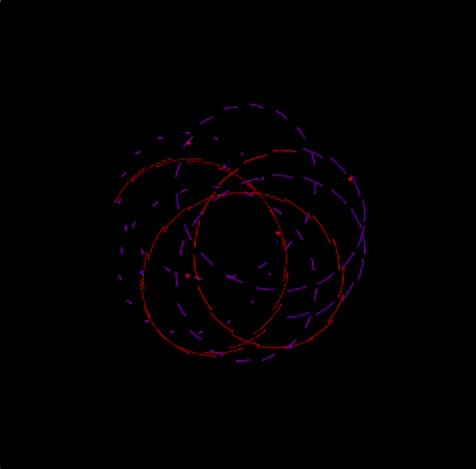
I chose to use the Epitrochoid Curve for my project this week. My code draws two curves—a blue and red one, and it’s pretty cool to see how and where they overlap with each other.
*because of the lag it’s really slow on WordPress ;(*
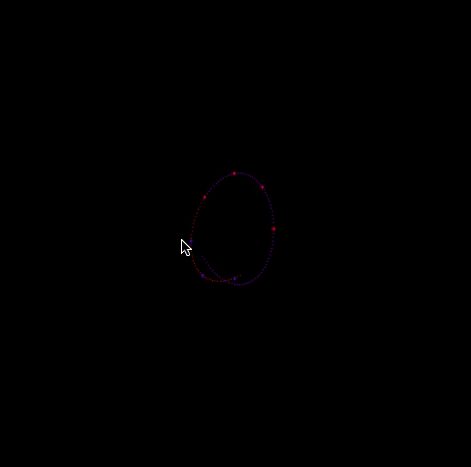
- Refresh the page to start from center with white background.
- Move the mouse back and forth to build contrast areas by changing the direction of the curve (inward or outward).
- Control the speed of curve drawn with mouse position.
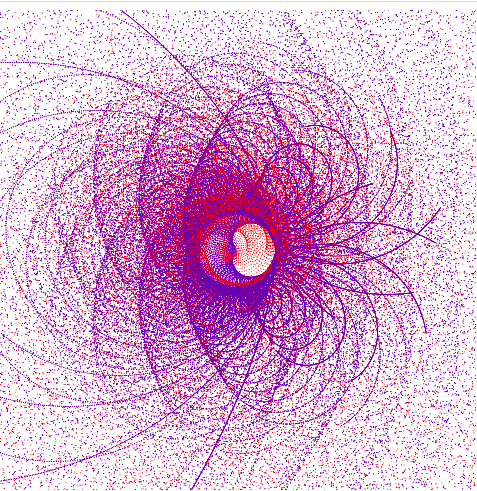
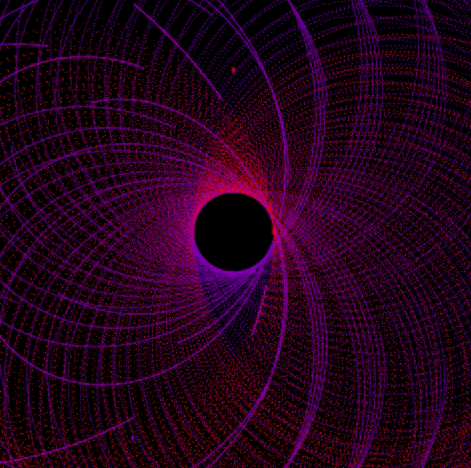
- Click the mouse to change background to black.
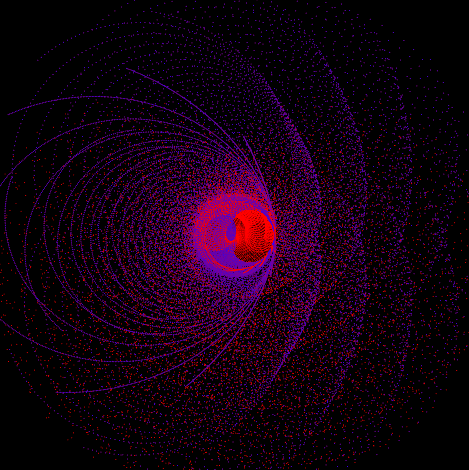
- Click and hold the mouse to erase all previous curve paths, and visualize the curve with stars that get brighter and dimmer with mouse position (brightest at lower right corner).
- Release the mouse to draw the curve at various starting points.
Maggie – Curves
//Maggie Ma
//Section D

//variables for equation on https://mathworld.wolfram.com/Epitrochoid.html
var a = 30; //radius of small circle
var b = 10; //radius of rotating perimeter circle
var h = 0; //height of curve from the center of b
var t; //time
var x;
var y;
var speed;


function setup() {
    createCanvas(500,500);
    background(255);
}

function draw() {
    noStroke();

	constrain(mouseX,0,width);
	constrain(mouseY, 0, height);

	//draws dots (without trail) when mouse is pressed
	//background changes to black
	//dots change in size with mouse position
    if (mouseIsPressed) {
		background(0);
		for (t = 0; t <TWO_PI; t += 1) {
			fill(0,0,255);
	    	epCurve2(); }

   		for (t= 0; t<PI; t+= 1) {
   			fill(255,0,0);
	    	epCurve2(); }
	}

	speed=map(mouseX,0,width,.5,-.5); //changes the speed and size of curve as mouseX moves
    a+=speed;
    h+=speed;

  	fill(255,0,0); //drawing red curve
    for (t =-PI; t < TWO_PI; t += .08) {
    	epCurve();
    }

    fill(0,0,255); //drawing blue curve
    for (t= -PI; t<PI; t+= .08) {
	    epCurve();
    }
}

function epCurve() { //Epitrochoid Curve function
	push();
    translate(width/2, height/2);
    //draw curve
    x=(a+b)*cos(t)-h*cos(((a+b)/b)*t);
    y=(a+b)*sin(t)-h*sin(((a+b)/b)*t);
    ellipse(x,y,0.8,0.8); //draws dots on canvas
    pop();
}

function epCurve2() { //Dotted curve when mouse is pressed
	push();
   	translate(width/2, height/2);
    //draw curve
    x=(a+b)*cos(t)-h*cos(((a+b)/b)*t);
    y=(a+b)*sin(t)-h*sin(((a+b)/b)*t);
    ellipse(x,y,0.5+mouseX/100,0.5+mouseY/100); //draws dots on canvas that change size w/ mouse position
    pop();
}