To create my interactive spirograph for this week’s project, my first step was to review existing curves on the Wolfram website and pick one that is simple, but can also give me exciting visuals when I use the combination of mouseX, map(), and constrain() functions.
I chose the Heart Curve, not only because it is an iconic shape/symbol but it’s parametric function allowed me to tweak the shape on all three of it’s curves.
If you notice this image, the cusp or crevice, the tip and the two mirroring bulges are the three curves that can be manipulated.
Using the given starter code, I first replaced the parametric equations and explored different types of curves, including the eight curve and the bean curve.
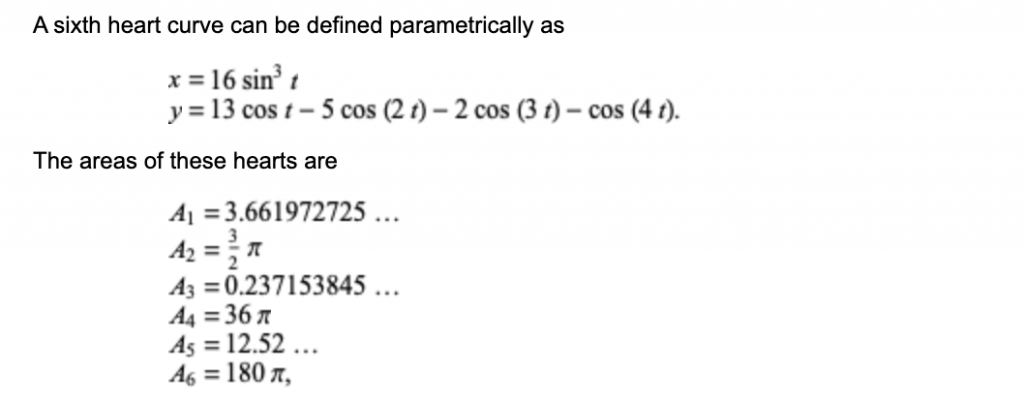
Finally, after fixing on the heart curve, I used the following parametric equations for the value of x and y:
1
2
x=a1 *sin(t)*sin(t)*sin(t);
y=a2 *cos(t)-a3 *cos(2*t)-2*cos(3*t)-cos(4*t);
a1 = 16, a2 = 13 and so on.
In the draw function, I set a1, a2 and a3 as variables and then used the mouseX to control the bulge and cusp of the heart.
Furthermore, I also added the rotate() function to setup, to reveal how the shapes create a spirograph. The frameRate() was also used to control the speed, to see the interactions and mouseX induced changes more clearly.
Here, is a video of an intermediate stage of the program:
One more important aspect of this effect is that I activated the alpha value in the fill() function so the mouseX movement also adds dynamic transparencies similar to “onion layers” in flash.
![[OLD FALL 2020] 15-104 • Introduction to Computing for Creative Practice](../../../../wp-content/uploads/2021/09/stop-banner.png)