![[OLD FALL 2020] 15-104 • Introduction to Computing for Creative Practice](https://courses.ideate.cmu.edu/15-104/f2020/wp-content/uploads/2021/09/stop-banner.png)
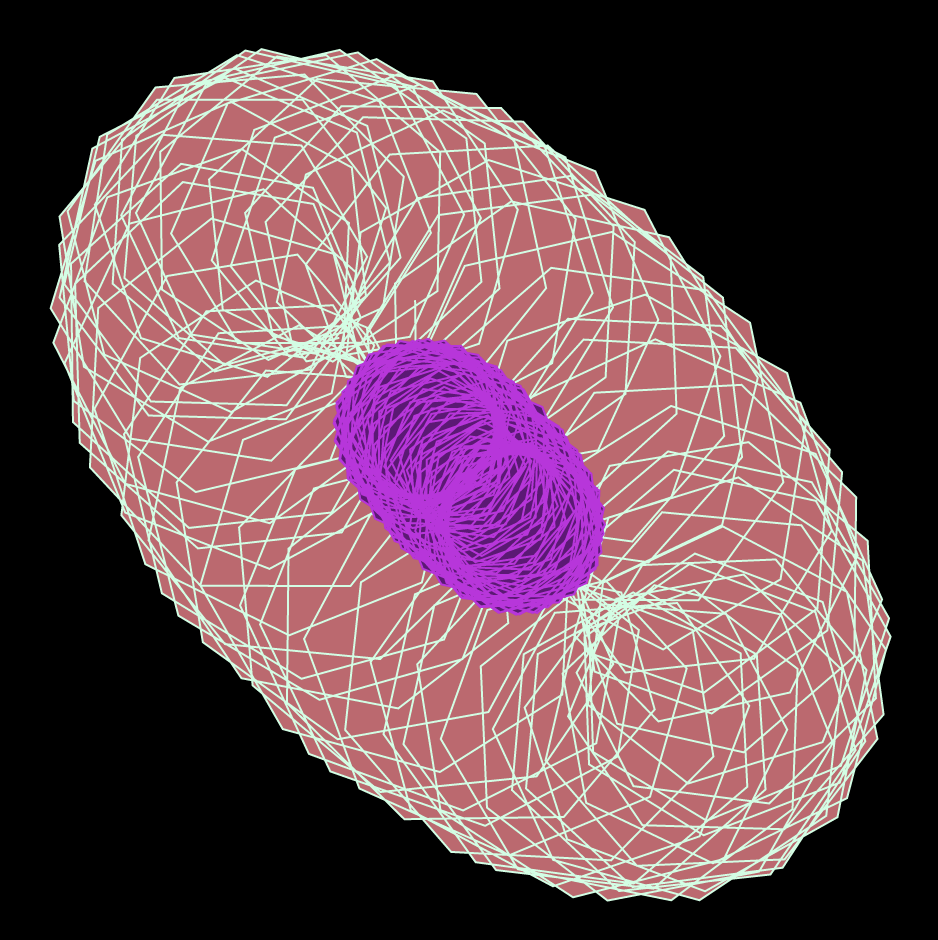
For this project, I decided to create a psychedelic display of colors and lines. I played around with Epitrochoid Curves and created two different circular displays. This resulted in a busy display of lines and curves that almost seemed 3d. I took a screenshot of my favorite shape, which looked like a cell underneath a microscope.
sketchDownload
//Se A Kim
//seak
//Section D

var nPoints = 300;
var angle = 100;

function setup() {
    createCanvas(480, 480);
}

function draw() {
    background(0);
    translate(width/2, height/2);
    rotate(mouseX/20);
    drawEpitrochoidCurve1();
    drawEpitrochoidCurve2();
}
    //Draw Epitrochoid 1
function drawEpitrochoidCurve1() {
    var a = map(mouseX, 0, 480, 0, 100);
    var b = map(mouseY, 0, 480, 0, 50);
    var c = map(mouseY, 0, 480, 0, 50);
    strokeWeight(1);
    stroke(200, 255, 226);
    fill(200, 100, 109);

    beginShape();
    for (var i=0; i<nPoints; i++) {
        var angle = map(i, 0, 20, 0, PI);
        x = (a) * cos(angle) - c * cos((a+b) * angle);
        y = (b) * sin(angle) - c * sin((a+b) * angle);
        vertex(x, y);
    }
    endShape();
}

    //Draw Epitrochoid 2
function drawEpitrochoidCurve2() {
    var a = map(mouseX, 0, 1000, 0, 10);
    var b = map(mouseY, 0, 1000, 0, 50);
    var c = map(mouseX, 0, 1000, 0, 50);
    strokeWeight(1);
    stroke(200, 20, 226);
    fill(100, 10, 120);

    beginShape();
    for (var i=0; i<nPoints; i++) {
        var angle = map(i, 0, 20, 0, PI);
        x = (b) * cos(angle) - c * cos((a+b) * angle);
        y = (a) * sin(angle) - c * sin((a+b) * angle);
        vertex(x, y);
    }
    endShape();
}