LO – 07

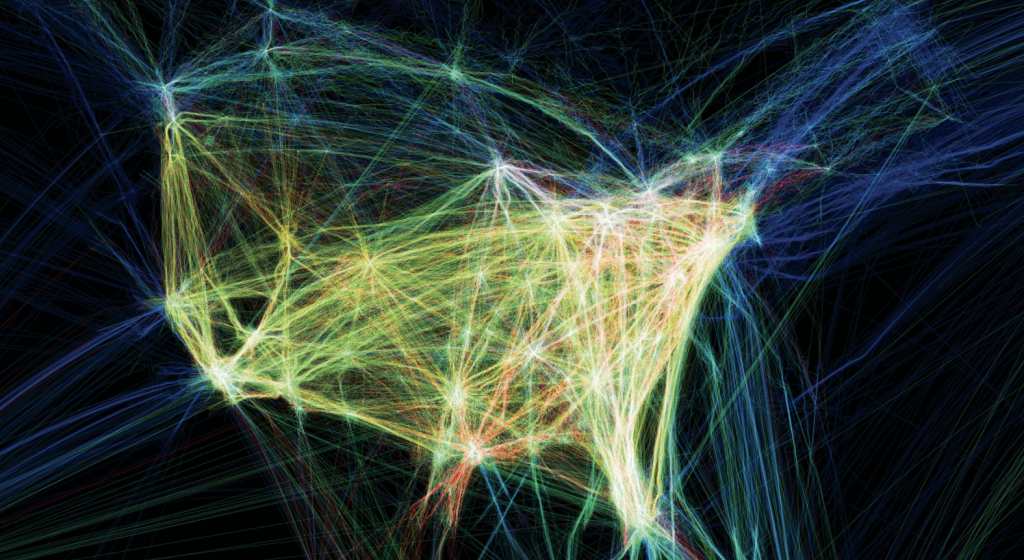
“Flight Patterns” by Aaron Koblin explores the cultural trends and relationships between humans and technology with the use of U.S. flight data. He used data from the U.S. Federal Aviation Administration which resulted in an animation that shows the frequent routes in popular western cities and traffic over certain geographical areas. I was initially drawn to this piece because I had initially thought it was randomly generated from its close up shots, but it was when the image zoomed out, did I see it in its entirety. This phantom like quality mixed with various colors and patterns illustrates a wide range of aircraft events and results in a mesmerizing depiction of our country. I enjoyed this time-lapse animation of the American air-traffic patterns because it parallels with our idea of what a recorded time lapse footage of these flight patterns may look like in real life.

Paths of air traffic over North America visualized in color and form.

Project 7 – Curves

For this project, I decided to create a psychedelic display of colors and lines. I played around with Epitrochoid Curves and created two different circular displays. This resulted in a busy display of lines and curves that almost seemed 3d. I took a screenshot of my favorite shape, which looked like a cell underneath a microscope.

sketchDownload
//Se A Kim
//seak
//Section D

var nPoints = 300;
var angle = 100;

function setup() {
    createCanvas(480, 480);
}

function draw() {
    background(0);
    translate(width/2, height/2);
    rotate(mouseX/20);
    drawEpitrochoidCurve1();
    drawEpitrochoidCurve2();
}
    //Draw Epitrochoid 1
function drawEpitrochoidCurve1() {
    var a = map(mouseX, 0, 480, 0, 100); 
    var b = map(mouseY, 0, 480, 0, 50); 
    var c = map(mouseY, 0, 480, 0, 50); 
    strokeWeight(1);
    stroke(200, 255, 226);
    fill(200, 100, 109); 

    beginShape(); 
    for (var i=0; i<nPoints; i++) {
        var angle = map(i, 0, 20, 0, PI);
        x = (a) * cos(angle) - c * cos((a+b) * angle);
        y = (b) * sin(angle) - c * sin((a+b) * angle);
        vertex(x, y);
    }
    endShape();
}

    //Draw Epitrochoid 2
function drawEpitrochoidCurve2() {
    var a = map(mouseX, 0, 1000, 0, 10); 
    var b = map(mouseY, 0, 1000, 0, 50); 
    var c = map(mouseX, 0, 1000, 0, 50); 
    strokeWeight(1);
    stroke(200, 20, 226);
    fill(100, 10, 120); 

    beginShape(); 
    for (var i=0; i<nPoints; i++) {
        var angle = map(i, 0, 20, 0, PI);
        x = (b) * cos(angle) - c * cos((a+b) * angle);
        y = (a) * sin(angle) - c * sin((a+b) * angle);
        vertex(x, y);
    }
    endShape();
}
A screen capture of my favorite shape

Project 6 – Clock

sketchDownload
//Se A Kim
//Section D
//seak

var x = [];
var y = [];
var dx = [];
var dy = [];
var c = [];


function setup() {
    createCanvas(400, 400);
    for (var i = 0; i < 100; i ++){
        x[i] = random(width);
        y[i] = random(height);
        dx[i] = random(-5,5);
        dy[i] = random(-5,5);
        c[i] = color(random(255), random(255), random(255));
    }
    frameRate(20);
}

function draw() {
    background(0);

    //drawing circles in the background
    noStroke();
    for(i = 0; i < 50; i++){
        fill(c[i], 100, 100);
        ellipse(x[i], y[i], 20);
        x[i] += dx[i];
        y[i] += dy[i];
        if(x[i] > width){
            x[i] = 0;
        } else if (x [i] < 0){
            x[i] = width;
        } 
        if (y[i] > height){
            y[i] = 0;
        } else if (y[i] <0){
            y[i] = height;
        }
    }

    //clock ellipses
    var s = second();
    var m = minute();
    var h = hour();

    push();
    translate(200, 200);
    noStroke();

    //second circle
    let sAngle = map(s, 0, 60, 0, 360);
    var sx = 50 * cos(radians(sAngle));
    var sy = 50 * sin(radians(sAngle));
    fill(c[i]);
    rotate(radians(-90));
    ellipse(sx, sy, 100);

    //minute circle
    let mAngle = map(m, 0, 60, 0, 360);
    var mx = 50 * cos(radians(mAngle));
    var my = 50 * sin(radians(mAngle));
    fill(255, 100, 100, 100);
    rotate(radians(90));
    ellipse(mx, my, 80);

    //hour circle
    let hAngle = map(h, 0, 60, 0, 360);
    var hx = 50 * cos(radians(hAngle));
    var hy = 50 * sin(radians(hAngle));
    fill(255, 255, 255, 100);
    rotate(radians(10));
    ellipse(hx, hy, 100);

    pop();
}

For this project, I wanted to practice some of our in class exercises/lectures and fully understand the cos and sin (polar coordinates) and on arrays. I integrated these topics with the clock.

LO 6

“Future Alterations” by Anders Hoff explores randomly generated art that explores future changes applied to a simple graph. He describes these changes as alterations in which these nested alterations are dependent to other alterations. He created a dependency graphs of futures. The graphs started with a single straight line or edge and then proceeds to select edges at random. The edges sometimes split in the middle or rotate around to produce new edges. I founded the implementation interesting because of its simplistic nature, but the results can be drastically different from one another. Hoff describes how having this functionality allows him to write an algorithm that almost looks like pseudo code. From my own experiences with coding, I can safely assume that he is using random variables in his functions, which result in multiple future changes.

“Future Alterations” by Anders Hoff

https://inconvergent.net/2020/future-alterations/

Project 5 – Wallpaper

For this project, I was feeling the spooky, Halloween theme so I decided to make some pumpkins. 🎃

sketchDownload
var s = 20;

function setup() {
    createCanvas(600, 600);
    background(255, 174, 0);
}

function draw() {
    background(255, 174, 0);
    for (var row = 1; row < 15; row += 2){
        for (var col = 1; col < 20; col += 3){
            blackCircle(row * 40, col * 40);

        }
    }

    for (var row = 1; row < 8; row += 2){
        for (var col = 1; col < 8; col += 2){
            pumpkin(row * 70, col * 70);

        }
    }
}

//pumpkin
function pumpkin(x, y){
    push();
    translate(x,y);
    noStroke();
    fill(54, 102, 51);
    rect(10, -30, 15, 20);
    fill(255, 85, 0);
    ellipse(20, 20, 100, 80);
    fill(0);
    triangle(0, 10, 5, 0, 10, 10);
    triangle(30, 10, 35, 0, 40, 10);
    arc(20, 20, 70, 60, 0, PI);
    fill(255, 85, 0);
    rect(20, 20, 10, 10);
    pop();
}


//blackcircle
function blackCircle(x, y){
    push();
    translate(x, y);
    noStroke();
    fill(237, 230, 9);
    circle(0, 0, 30);
    fill(0);
    circle(0, 0, 10);
    pop();
}

LO 5

“Platonic solids” by Michael Hansmeyer explores generated geometric 3D shapes that complete a complex form. He has created multiple different final forms which all stem from the same single process with a simple change in variables. I admire how such a subtle change can create a huge different in the final patterns of this 3D design. It influences the branching, fractalization, and build up of the geometric shapes. It’s also worth noting that this system can be applied to multiple scales. The processes at the core of this project have two parts: topological rules and weighting rules. Hansmeyer states that these rules specify how the positions of these vertices are based from the combinations of the vertices and the shapes edges and faces. By introducing parameters that allow for variation, the final result encapsulates a rounded and highly diverse attributes in its body.

Platonic Solids by Michael Hansmeyer

http://www.michael-hansmeyer.com/platonic-solids#:~:text=Platonic%20Solids%20(2008),primitive%20given%20an%20appropriate%20process.

Project 04 – String Art

sketchDownload
// Se A Kim
// seak
// Section D

var numLines = 100;

function setup() {
    createCanvas(400, 300);
    background(200);
    dx1 = (0-0)/numLines;
    dy1 = (100-0)/numLines;
    dx2 = (200-0)/numLines;
    dy2 = (400-0)/numLines;
}

function draw() {
    strokeWeight(.5);
    background(255);

    var x1 = 0;
    var y1 = 0;
    var x2 = 0;
    var y2 = 200;

    for (var i = 0; i <= numLines; i += 1) {
        stroke(0, 100, 200);
        line(0, i*3, 400, 0);
        line(100, i*3, 400, 0);   
        line(200, i*3, 400, 0);   
        line(300, i*3, 400, 0); 
        stroke(0, 200, 300); 
        line(i*4, 100, 0, 0);
        line(i*4, 200, 0, 0);
        line(i*4, 300, 0, 0);
        line(i*4, 400, 0, 0);
        stroke(300, 200, 300);
        line(400, 300, i*3, 100);
        line(400, 300, i*3, 200);
        line(400, 300, i*3, 300);
        line(400, 300, i*3, 400);
        stroke(300, 200, 100);
        line(0, 300, i*4, 100);
        line(0, 300, i*4, 200);
        line(0, 300, i*4, 300);
        line(0, 300, i*4, 400);

        x1 += dx1;
        y1 += dy1;
        x2 += dx2;
        y2 += dy2;
    
    }
}

I decided to create multiple lines coming out of the four corners of the canvas to get a better understanding of drawing string lines.

LO 4 – Sound Art

“Multiverse” by fuse works is a real time audiovisual installation that explores the evolution of universes through generative graphics and sounds. A multiverse is a system of infinite number of universes that exist outside our space-time. I admire the artists visual take on the cosmos and their choice of presenting it in a 7.5 meter high vertical projection that is specifically placed inside a deconsecrated church. Interacting with this piece immediately draws the viewer in and one may feel encapsulated by its hypnotic visuals. They used openFrameworks that generates various scenes which interacts with Ableton Live and Max/MSP for the production of the generative sound system. The gravitational collapse of matter theorized by Lee Smolin describes that matter does not end in a singular black hole but through a, “child – universe”. This idea is captured by the simulation’s generative nature that allows the creation of infinite variation of ephemeral images.

Project 03 – Dynamic Drawing

For this project, I was inspired by abstract artist, Kandinsky. I took some of the components in composition 8, and made it more interactive.

sketchDownload
//Se A Kim
//Section D

function setup() {
    createCanvas(600, 450);
    background(236, 233, 230);

}

function draw() {
background(236, 233, 230); 

var bigCircle = constrain(pmouseX, 50, 200);
var midCircle = constrain(pmouseX, 50, 170);
var smallCircle = constrain(pmouseX, 50, 80);
var miniCircle = constrain(pmouseY, 0, 50);

var linex = constrain(pmouseX, 200, 500);
var liney = constrain(pmouseY, 100, 500);

//var leftTri = constrain(pmouseY, 100, 300);

noStroke();

//circle layers
fill(217, 167, 164, mouseY/2);
ellipse(100, 100, bigCircle);
fill(39, 26, 34);
ellipse(100, 100, midCircle);
fill(120, 65, 116, mouseY);
ellipse(100, 100, smallCircle);


frameRate(10);
stroke(3);
//double lines following mouse
line(mouseX, mouseY, pmouseX, pmouseY);
line(mouseX - 10, mouseY - 10, pmouseX -10, pmouseY - 10);

//lines

line(150, 300, linex, 300);
line(500, 430, 500, liney);
line(550, 430, linex, liney);
line(500, 10, linex + 40, liney + 40);
line(600, 0, linex - 80, liney - 80);


//arcs
stroke(1);
fill(255, 255, 255);
arc(200, 300, 80, 80, PI, 0);
arc(280, 300, 80, 80, PI, 0);
arc(360, 300, 80, 80, PI, 0);
arc(440, 300, 80, 80, PI, 0);

//large triangle
fill(244, 241, 242, mouseY/2);
triangle(300, 800 - pmouseY, 400, 300 - pmouseY, 500, 800 - pmouseY);


noStroke();
//multiple circles
fill(299, 197, 94, mouseY);
ellipse(100, 350, miniCircle);
fill(26, 104, 155, mouseY);
ellipse(230, 400, miniCircle);
ellipse(500, 300, miniCircle);
ellipse(450, 150, miniCircle);


}

LO 3 – Computational Fabrication

Silk Pavilion by Mediated Matter Group

The Silk Pavilion is an incredible sculpture that combines the biological and technological world together. The silkworm’s ability to generate 3D cocoons out of silk and the digital fabrication of geometric architectural shapes were seamlessly blended to create a sturdy, yet light structure. MIT Media Lab started with a CNC machine that created an underlying structure that will hold each section of the silk and ultimately guide the silkworms.The group believes in the power of a single material as a system to enable strength and tension. There is an intersection between technology and biology which digital fabrication technologies can explore. In this case, the silkworms build and destroy parts of the nest for it to become a stronger material. They used computational techniques to model the natural processes of growth. This theme is allowing growth to happen naturally as seen in their computational design, by allowing the machine to determine which patterns would be most durable.