![[OLD FALL 2020] 15-104 • Introduction to Computing for Creative Practice](https://courses.ideate.cmu.edu/15-104/f2020/wp-content/uploads/2021/09/stop-banner.png)
Data Visualization
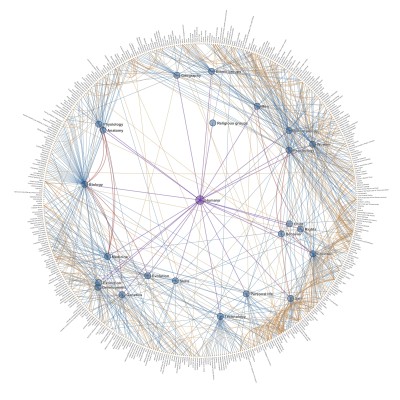
According to Wikipedia, “Wikiracing is a game using the online encyclopedia Wikipedia which focuses on traversing links from one page to another”. I used to play Wikiracing in high school due to school-provided computer restrictions which severely limited entertainment websites, (3-Clicks-To-Jesus was a popular variation of this game requiring the player to start at a random word and try to reach ‘Jesus’ in – you guessed it – three clicks). When I saw Chris Harrison’s Wikipedia data visualization project, ‘Cluster Ball’, I was immediately reminded of Wikiracing and the intricately woven nature of the Wiki universe. This graphic elegantly depicts the interrelations of wikipedia articles that have a common denominator. As stated in the project description, links between category pages are illustrated by edges, which are color coded to represent their depth from the parent node. Not only would this graphic serve as a handy aid in an intense round of WIkiracing, but it uses simple means to demonstrate how humans communicate and organize language. I admire this work because I think it is surprisingly moving to see how organically the structures of interrelation seem to develop and how every word contributes to and depends upon a greater system of words. The, overwhelming, intricate, and organic architecture and relationships of a single word to a system of words reminds me of ants working together in clearly systematic ways that I don’t quite understand, but can’t help but appreciate the intricacy of.
https://www.chrisharrison.net/index.php/Visualizations/ClusterBall