![[OLD FALL 2020] 15-104 • Introduction to Computing for Creative Practice](https://courses.ideate.cmu.edu/15-104/f2020/wp-content/uploads/2021/09/stop-banner.png)
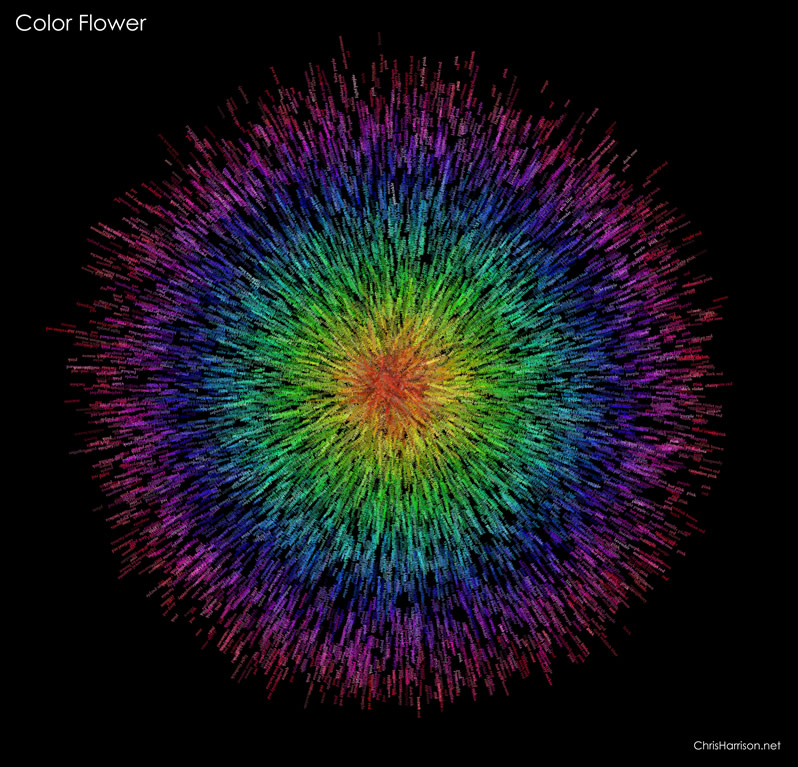
I particularly enjoyed the recommended Chris Harrison‘s ColorFlower project, where he ran 16,276 data points of known and named colors and organized them by their hue to create rainbow visualizations. Harrison had to play a hand in helping the algorithm determine the difference between brown and red, etc. He also used an aspect of randomization to make the visualizations seem more organic and textural.