![[OLD FALL 2020] 15-104 • Introduction to Computing for Creative Practice](../../../../wp-content/uploads/2021/09/stop-banner.png)
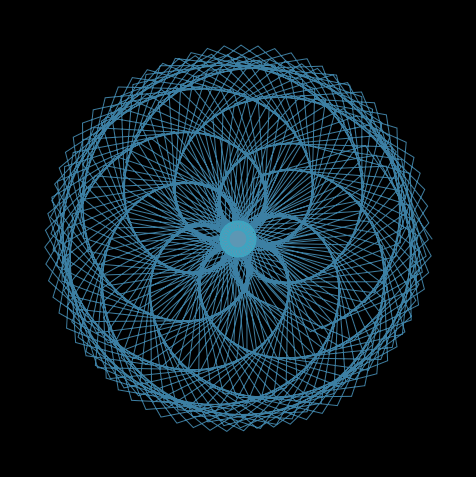
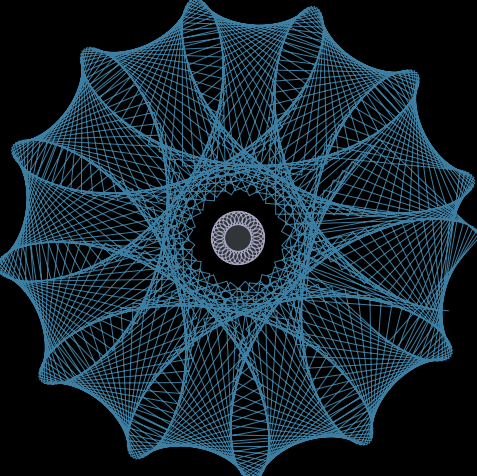
Curvehc
var nPoints = 600;

function setup(){
    createCanvas(480, 480);

}

function draw(){
    background(0);
    //calling functions
    hypotrochoid();
    epicycloid();
}

function hypotrochoid(){
    //drawing hypotrochoid
    //https://mathworld.wolfram.com/Hypotrochoid.html
    push();
    noFill();
    stroke(57, 139, 173)
    translate(width / 2, height / 2);
    var x = constrain(mouseX, 0, width);
    var y = constrain(mouseY, 0, height);
    var a = map(x, 0, width, 70, 150);
    var b = map(y, 0, height, 0.5, 4);
    var h = constrain(a/2, 100, 200);
    beginShape();
    for (var i = 0; i < nPoints; i++) {
        var t = map(i, 0, nPoints, 0, TWO_PI);
        x = (a - b) * cos(t) + h * cos(((a - b) / b) * t);
        y = (a - b) * sin(t) - h * sin(((a - b) / b) * t );
        vertex(x, y);
    }
    endShape();
    pop();
}

function epicycloid(){
    //drawing epicycloid
    //https://mathworld.wolfram.com/Epicycloid.html
    push();
    translate(width / 2, height / 2)
    var x = constrain(mouseX, 0, width);
    var y;
    var a = map(x, 0, width, 10, 20);
    var b = a / 30;
    var h = constrain(mouseY / 9, 0, 0.7 * height);
    var ph = mouseX / 25;
    fill(202, 223, 232, 70);
    stroke(90 + 98 * sin(millis() / 500), 174, 200); //making the color change smoothly
    beginShape();
    for (var i = 0; i < nPoints; i++) {
        var t = map(i, 0, nPoints, 0, TWO_PI);
        x = (a + b) * cos(t) - h * cos(ph + t * (a + b) / b);
        y = (a + b) * sin(t) - h * sin(ph + t * (a + b) / b);
        vertex(x, y);
    }
    endShape(CLOSE);
    pop();
}
At first, I wasn’t really sure how I was supposed to do the project since it looked complex. I also didn’t know what type of shapes I should create either. However, using the mathematical formula turned out to be not as overwhelming as I thought it would be since they created the shapes for me. I tried doing this project by exploring different types of curves and ended up choosing hypotrochoid and epicycloid. I began by drawing the hypotrochoid first by plugging in different numbers. Once I got that in place, I thought it looked empty in the middle so I then added an epicycloid curve. Although it was challenging to figure out which variable controls what, it was satisfying to see the end result.