![[OLD FALL 2020] 15-104 • Introduction to Computing for Creative Practice](https://courses.ideate.cmu.edu/15-104/f2020/wp-content/uploads/2021/09/stop-banner.png)
Nathan Yau was who I wrote about in my last Looking Outwards and he spoke in the 2019 Eyeo where he elaborates on his design journey. He specializes in creating data visualizations that are easy to read and concise. He created the website Flowingdata.com where he creates data visualizations for himself and others. He is also the author of both Data Points: Visualization That Means Something and Visualize This: The FlowingData Guide to Design, Visualization, and Statistics. Essentially he wants to make data more accessible and easier to read to everyday people.
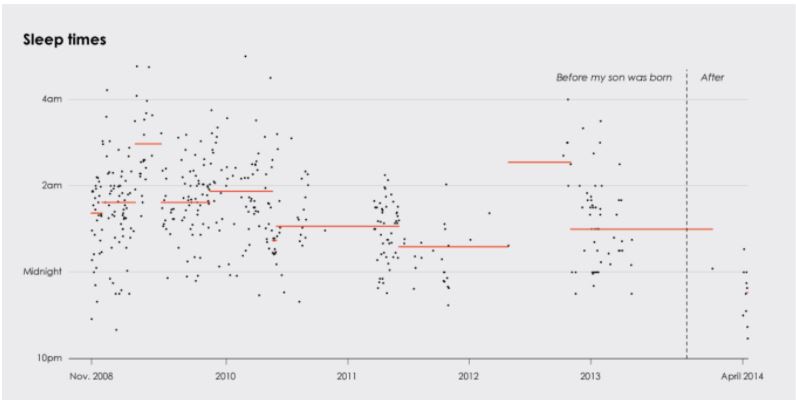
What I admire is that he is a designer for the people. Nathan designs with the idea that data is only effective if it is able to get the message across without boring or confusing the reader. He even creates visual representations of his own personal life that other people may not be interested in. He creates them for himself, where he can see the relationships between data only he finds relevant. He mentions that he recently has a child and made a chart about when he sleeps. He is able to easily analyze and interpret all this information because of his visualization skills. He talks about his approach to data visualizations in a comedic and sentimental way and relating how he found his passion for his growth. His explanation and story reinforce the idea of simple yet developed data visualizations.