Final Project: COVID cases and temperatures

https://editor.p5js.org/ssahasra/present/mf6vOSPgw

This is a video of the Final p5.js program.

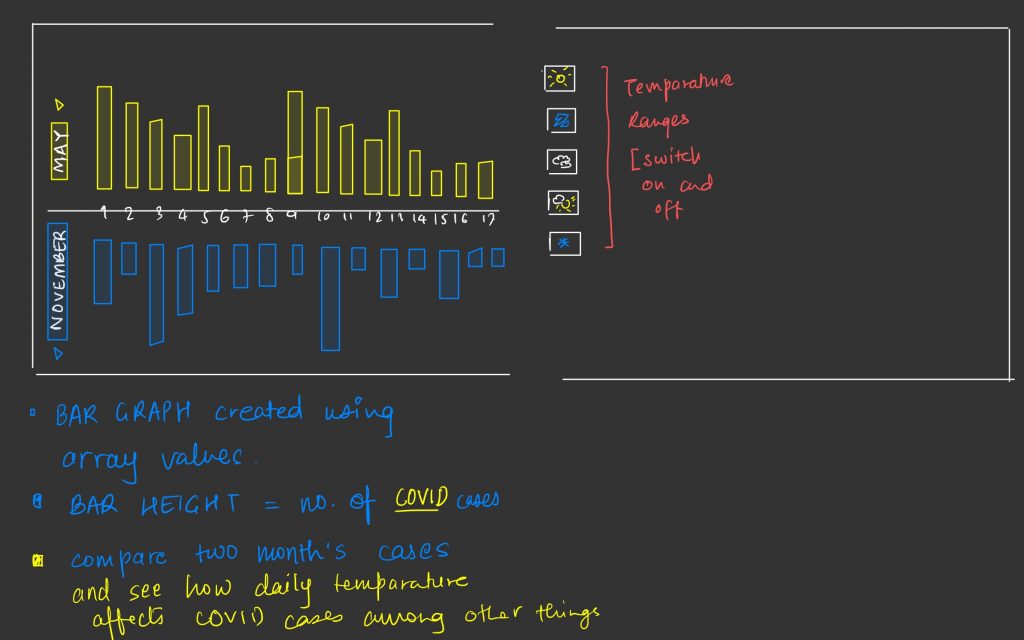
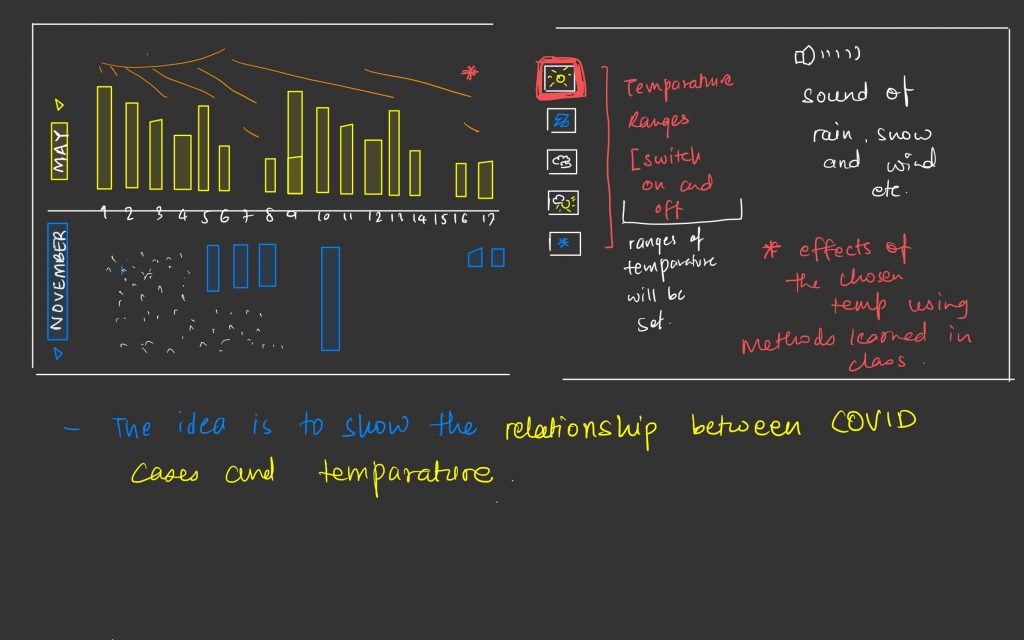
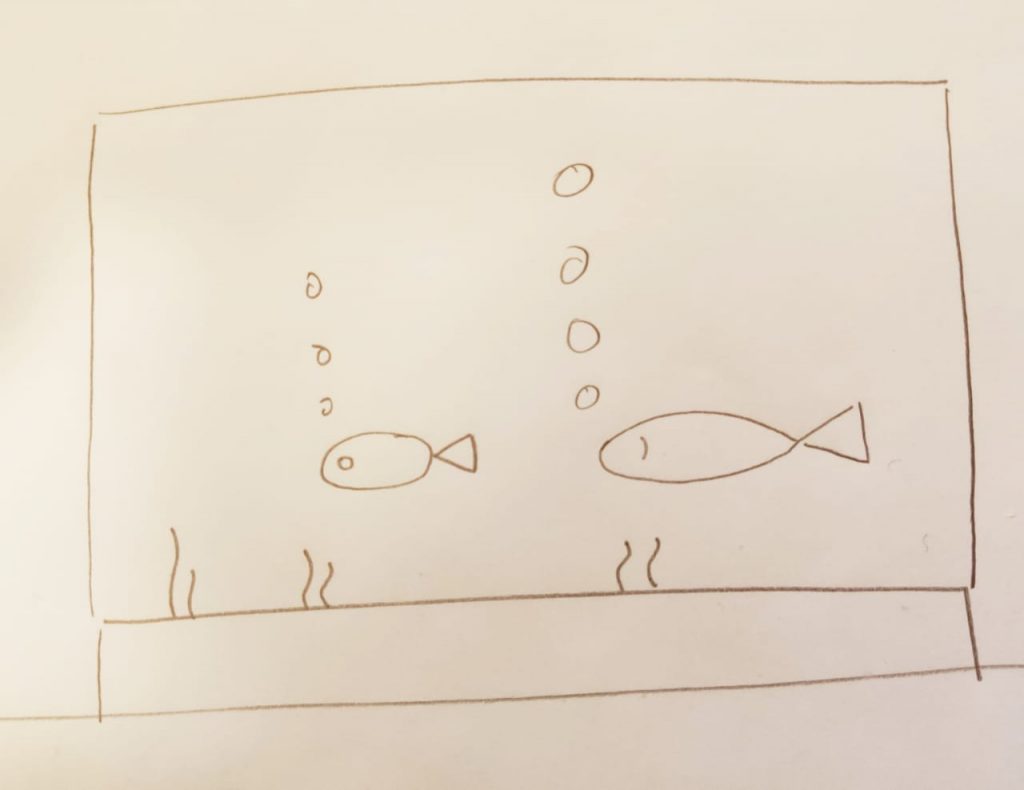
The idea was to correlate temparatures and COVID cases of two months far apart from each other in the year 2020.

I used arrays to fill in the values of the number of cases (height of bar) with loops and used the buttons [mouse interactions] and array, objects to create effects of different weather conditions. For some of the weather effects I sourced code from current projects on the internet.

[This was the very first version, and evolved to a much different version with iteration after I received feedback from the Instructor and TAs

After receiving feedback on my proposal, I made two key changes:

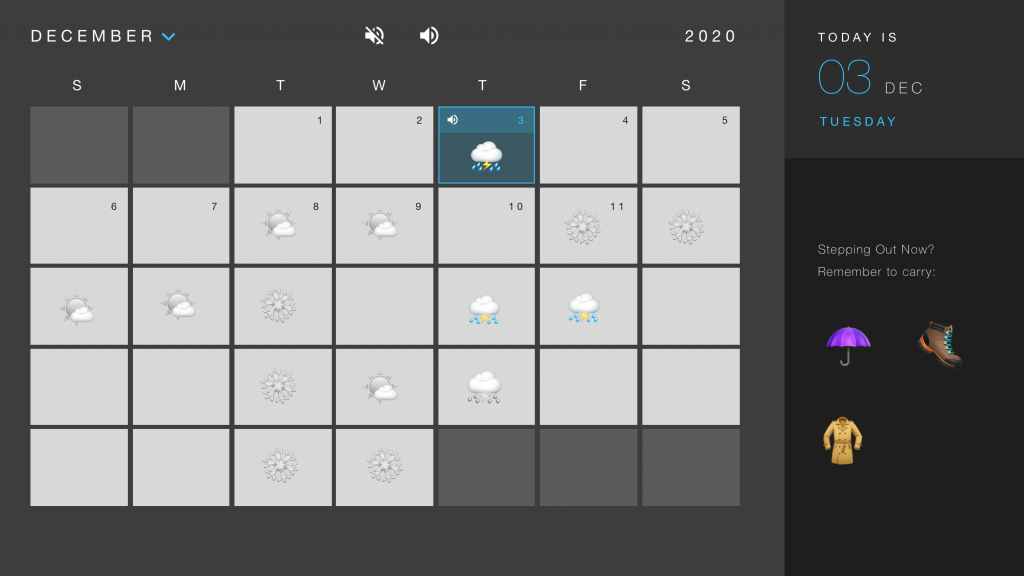
1. Instead of using files to load data I added the values to indices of an array, to create a data visualization + monthly calendar that shows the number of COVID cases

2. I made it more relevant to the theme of 2020. Earlier I was working only with temperature data, but now I decided to represent the relationship between temperature and COVID cases.

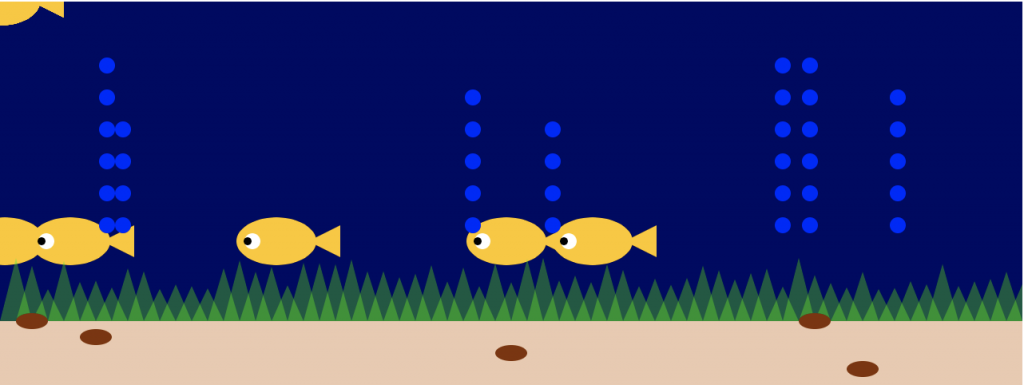
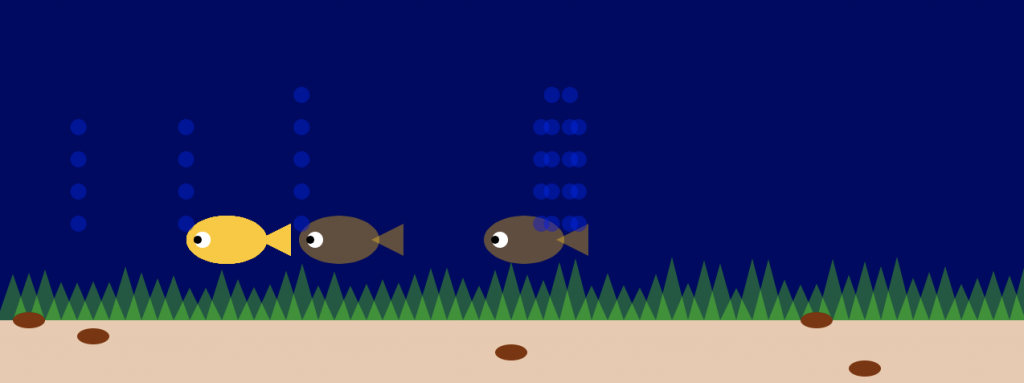
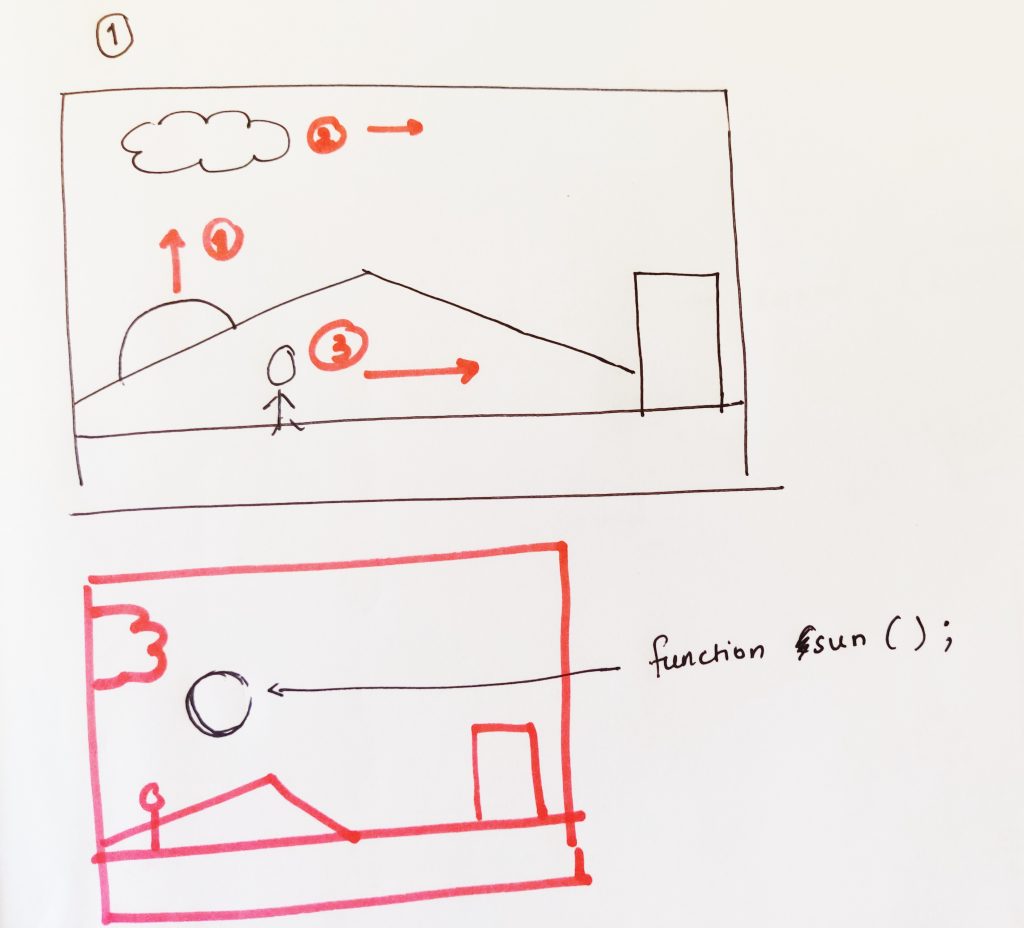
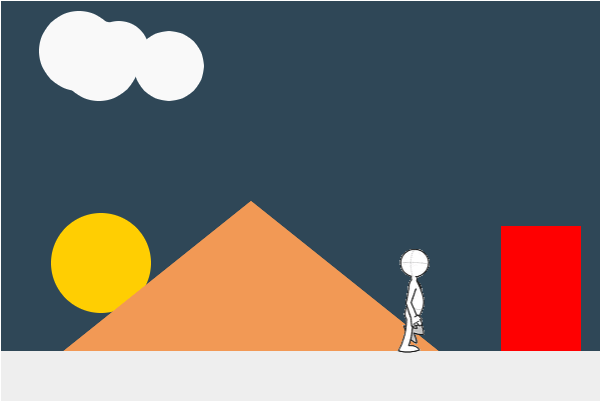
The central idea of my projects is to create an interactive visualization + calendar that allows the viewer to compare different months of the year and see how temperature affects the rise in COVID cases (although there are of course other factors for the rise) Furthermore, I want to use mouse interactions to filter certain days when temperatures are in particular range using the buttons on the right (see diagram and code). I am still in the process of adding interactivity and controls using the <function mousePressed()> Optionally, a hover state over one or two of the bars (if time permits, to show the temperature and number of COVID cases to make it a more realistic visualisation)

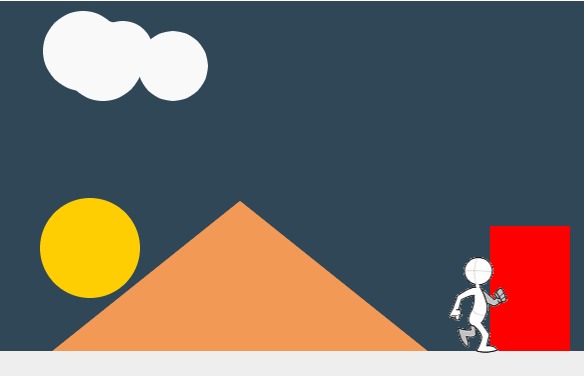
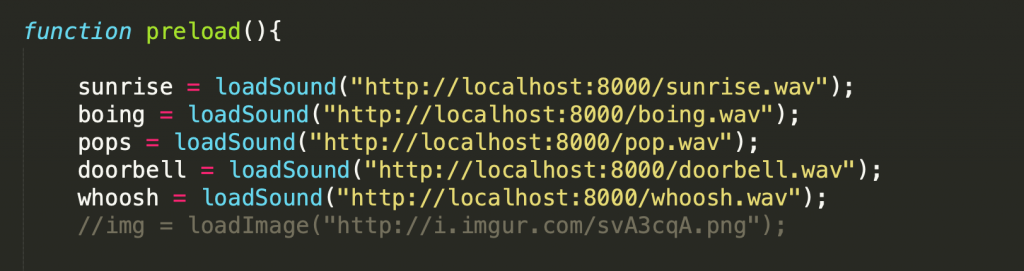
When the button is pressed, some bar graphs that are not in that temperature range, will disappear and I want to use random motion, I learnt in class to create effects of snow, rain, sun etc in the background of each month. If I am successful in this, as a next step, I would also like to add sound files that create sound effects along with the visual effects of the weather. For the visual effects, my plan is to use the code I used for the snow and change parameters, color, speed etc, to create the other weather effects. For examples: raindrops will be blue and would sway less, and fall down in straighter lines than snow.

Below is the code snippet for the entire final program:

let lastFramePress = false;
let toggle = false;
let value = 0;
let button;
let snowflakes = []; // array to hold snowflake objects
let rain = [];

let snow ;


mayCases = [1540, 1307, 1008, 913, 975, 1022, 1160, 1352, 1160, 
            1376, 520, 850, 787, 964, 1020, 1050, 517, 931, 728, 
            747, 1101, 1053, 797, 554, 700, 517, 773, 666, 761, 716, 429]

mayMidTempCases = [0, 1307, 1008, 0, 0, 0, 1160, 0, 0, 
            1376, 0, 0, 787, 964, 0, 1050, 0, 931, 728, 
            747, 1101, 1053, 797, 0, 0, 0, 0, 0, 761, 716, 429] //on high temparature days

mayHighTempCases = [0, 0, 0, 0, 0, 0, 0, 0, 0, 
            0, 0, 0, 0, 0, 1020, 0, 517, 0, 0, 
            0, 0, 0, 0, 554, 700, 517, 773, 666, 761, 716, 429] //on mid temparature days    

mayLowTempCases = [1540, 0, 0, 913, 975, 1022, 0, 1352, 1160, 
            0, 520, 850, 0, 0, 0, 0, 0, 0, 0, 
            0, 0, 0, 0, 0, 0, 0, 0, 0, 0, 0, 0] //on low temparature days           

novCases = [2815, 3648, 3236, 2580, 4562, 4322, 4098, 6023,
            5834, 4395, 4647, 6241, 5721, 6486, 6881, 7028, 
            5874, 6541, 6462, 6365, 6956, 7427, 8362, 6883,
            5144, 5584, 6956, 8654, 11268, 5000]

novHighTempCases = [0, 0, 3236, 2580, 4562, 4322, 0, 0,
            0, 0, 0, 0, 0, 0, 0, 0, 
            0, 0, 0, 0, 0, 0, 0, 0,
            0, 0, 0, 0, 0, 0]

novMidTempCases = [2815, 3648, 0, 0, 0, 0, 4098, 6023,
            0, 0, 4647, 0, 0, 0, 6881, 7028, 
            5874, 6541, 0, 0, 0, 7427, 8362, 6883,
            0, 5584, 0, 0, 0, 0]

novLowTempCases = [0, 0, 0, 0, 0, 0, 0, 0,
            0, 4395, 0, 6241, 5721, 6486, 0, 0, 
            0, 0, 6462, 0, 6956, 0, 0, 0,
            5144, 0, 6956, 8654, 11268, 5000]


function preload() {
    cloud = loadImage('https://i.imgur.com/MsvLwqH.png');   
    snowFlake = loadImage('https://i.imgur.com/wvzYocn.png');
    sun = loadImage('https://i.imgur.com/AGRTqDm.png');
}


function setup() {

    //star-size
    let SWH1 = random(2, 8);
    let SWH2 = random(6, 10);
    let SWH3 = random(10, 13);


    background(51,59,68);
    createCanvas(1300, 900);

    button = createButton("☀️");
    button.mousePressed();
    button.position(1180, 90);
    button.size(50,50);
    button.style('font-size', '25px');


    button = createButton("☁️");
    button.mousePressed();
    button.position(1180, 160);
    button.size(50,50);
    button.style('font-size', '25px');

    button = createButton("❄️");
    button.mousePressed();
    button.position(1180, 230);
    button.size(50,50);
    button.style('font-size', '25px');


}

function draw() {
    background(51,59,68);
    fill(255);
    textSize(12);
    text ('M A Y  :  C O V I D   C A S E S', 50, 80);
    text ('N O V E M B E R  :  C O V I D   C A S E S', 50, 780);

    textSize(21);
    text ('D o    C O V I D    C a s e s    I n c r e a s e    W h e n    T e m p ar a t u r e s    L o w e r  ?', 50, 840, 900, 60);
    strokeWeight(3.2);
    fill(255,10);
    noStroke();

    rect(50,80,width-200,320);
    rect(50,450,width-200,320);
    
    translate(30,50);

    fill(255, 80);
    may();

    fill(255,0,0,80);
    november();
    
    calendar();

    //sunrays();
    rainfall();

    noStroke();
    
    fill(255);
    //mayHigh();

    mousePressed();


    fill(255,10);

    rect(1137, 27, 60, 60);
    rect(1137, 97, 60, 60);
    rect(1137, 167, 60, 60);


}


function calendar() {
  fill(51,59,68);
  for (let i=0;i<31;i++) {
      let index = i + 1;
      //stroke(255, 50);
      
      push();
      fill(255);
      noStroke();
      textSize(12);
      text(index, i*(245/7)+38, 380);
      pop();
    }

}


 //____////____////____////____////____////____////____////____////____////____////____////____//   

function createSnowflake() {
    // create a random number of snowflakes each frame
    let t = frameCount / 60; // update time

    for (let i = 0; i < random(5); i++) {
        fill(255);
        snowflakes.push(new snowflake()); // append snowflake object
    }

    // loop through snowflakes with a for..of loop
    for (let flake of snowflakes) {
       flake.update(t); // update snowflake position
       flake.display(); // draw snowflake
    }
}

function snowflake() {
  //referenced from the p5.js open source examples
  // initialize coordinates
  this.posX = 0;
  this.posY = random(-50, 0);
  this.initialangle = random(0, 2 * PI);
  this.size = random(2, 5);

  // radius of snowflake spiral
  // chosen so the snowflakes are uniformly spread out in area
  this.radius = sqrt(random(pow(width / 2, 2)));

  this.update = function(time) {
    // x position follows a circle
    let w = 0.6; // angular speed
    let angle = w * time + this.initialangle;
    this.posX = width / 2 + this.radius * sin(angle);

    // different size snowflakes fall at slightly different y speeds
    this.posY += pow(this.size, 0.5);

    // delete snowflake if past end of screen
    if (this.posY > height) {
      let index = snowflakes.indexOf(this);
      snowflakes.splice(index, 1);
    }
  };

  this.display = function() {
    ellipse(this.posX, this.posY, this.size);
  }
}

//____////____////____////____////____////____////____////____////____//


function createRain() {
    // create a random number of snowflakes each frame
    let t = frameCount / 60; // update time

    for (let i = 0; i < random(5); i++) {
        fill(255);
        rain.push(new rainfall()); // append snowflake object
    }

    // loop through snowflakes with a for..of loop
    for (let drop of rain) {
       drop.update(t); // update snowflake position
       drop.display(); // draw snowflake
    }
}

function rainfall() {
  this.posX = 10;
  this.posY = random(0, width);
  this.initialangle = random(0, PI);
  this.size = random(4, 20);

  // radius of snowflake spiral
  // chosen so the snowflakes are uniformly spread out in area
  this.radius = sqrt(random(0,1000), 1);

  this.update = function(time) {
    // x position follows a circle
    let w = 1; // angular speed
    let angle = w * time + this.initialangle;
    this.posX = width / 35 + 1000 * sin(angle); // change this angle for rain

    // different size snowflakes fall at slightly different y speeds
    this.posY += pow(this.size, 5);

    // delete snowflake if past end of screen
    if (this.posY > 260) {
      let index = rain.indexOf(this);
      rain.shift(index, 3);
    }
  }

  this.display = function() {
    ellipse(this.posX, this.posY, this.size);
  }
}

//____////____////____////____////____////____////____////____////____////____//

function sunrays() {


  rays = random(280, 650);
 
  //stars in the universe
  fill(250, 200, 0);
  ellipse(mouseX*1.1, mouseY*1.8, random(2, 8), random(2, 8));
  ellipse(mouseX*1.3, mouseY*2.5, random(6, 10), random(6, 10));
  ellipse(mouseX*2.3, mouseY*1.5, random(10, 13), random(10, 13));
  ellipse(mouseX/1.1, mouseY/1.8, random(2, 8), random(2, 8));
  ellipse(mouseX/1.3, mouseY/2.5, random(6, 10), random(6, 10));
  ellipse(mouseX/2.3, mouseY/1.5, random(10, 13), random(10, 13));
  
  //glow
  fill(200, 130, 10, 20);
  ellipse(0, 0, (frameCount % 500)*2, (frameCount % 500)*2);
  ellipse(0, 0, (frameCount % 500)*4, (frameCount % 500)*4);
  ellipse(0, 0, (frameCount % 500)*8, (frameCount % 500)*8);
  ellipse(0, 0, (frameCount % 500)*16, (frameCount % 500)*16);
  ellipse(0, 0, (frameCount % 500)*24, (frameCount % 500)*24);
  
  //sun
  fill(250, 200, 0);
  ellipse(5, -11, rays - 20, rays - 30);

}


function may() {
    for (var i=0; i <= mayCases.length; i++) {
        fill(255, 99);
        rect((i*35+3)+25,350,33,-mayCases[i]*0.035);
        //ellipse((i*35+3)+25,190,-mayCases[i]*0.035);
    }
    if (mayCases[i]*0.25 >= 20) {
        fill(255, 99);
    }

}

function mayHigh() {
    for (var i=0; i <= mayHighTempCases.length; i++) {
        fill(255,99);
        rect((i*35+3)+25,350,33,-mayHighTempCases[i]*0.035);
    }
    if (mayHighTempCases[i]*0.25 >= 20) {
        fill(255,0,0,99);
    }
}

function mayMid() {
    for (var i=0; i <= mayMidTempCases.length; i++) {
        fill(255,99);
        rect((i*35+3)+25,350,33,-mayMidTempCases[i]*0.035);
    }
    if (mayMidTempCases[i]*0.25 >= 20) {
        fill(255,99);
    }
}

function mayLow() {
    for (var i=0; i <= mayLowTempCases.length; i++) {
        fill(255,99);
        rect((i*35+3)+25,350,33,-mayLowTempCases[i]*0.035);
    }
    if (mayLowTempCases[i]*0.25 >= 20) {
        fill(255,0,0,99);
    }
}


function november() {
    for (var i=0; i <= novCases.length; i++) {
        rect((i*35+3)+25,400,33,novCases[i]*0.035);
        //ellipse((i*35+3)+25,560,-novCases[i]*0.035);
    }
}

function novLow() {
    for (var i=0; i <= novLowTempCases.length; i++) {
        fill(255,0,0,99);
        rect((i*35+3)+25,400,33,novLowTempCases[i]*0.035);
        //ellipse((i*35+3)+25,560,-novCases[i]*0.035);
    }
    if (novLowTempCases[i]*0.25 >= 20) {
        fill(255,0,0,99);
    }
}

function novMid() {
    for (var i=0; i <= novMidTempCases.length; i++) {
        fill(255,0,0,99)
        rect((i*35+3)+25,400,33,novMidTempCases[i]*0.035);
        //ellipse((i*35+3)+25,560,-novCases[i]*0.035);
    }
    if (novMidTempCases[i]*0.25 >= 20) {
        fill(255,0,0,99);
    }
}

function novHigh() {
    for (var i=0; i <= novHighTempCases.length; i++) {
        fill(255,0,0,99);
        rect((i*35+3)+25,400,33,novHighTempCases[i]*0.035);
        //ellipse((i*35+3)+25,560,-novCases[i]*0.035);
    }
    if (novHighTempCases[i]*0.25 >= 20) {
        fill(255,0,0,99);
    }
}


function mousePressed() {
  //rect(1137, 27, 60, 60);
  //rect(1137, 97, 60, 60);
  //rect(1137, 167, 60, 60);
  if (mouseX >= 1137 && mouseX <= 1197 && mouseY >= 40 && mouseY <= 110) {
    mayHigh();
    novHigh();
    sunrays();
    
  } else if (mouseX >= 1137 && mouseX <= 1197 && mouseY >= 110 && mouseY <= 180) {
    mayMid();
    novMid();
    createRain();
  } else if (mouseX >= 1137 && mouseX <= 1197 && mouseY >= 200 && mouseY <= 250) {
    mayLow();
    novLow();
    createSnowflake();

}
}

Project 11: Deep Sea

For the project this week, I wanted to create a scene that depicts marine life, with fish seaweed and bubbles blown by the wish.

The objects in this scene are of three types:

  1. Stable – pebbles, seabed
  2. Movement – seaweed, which moves between constraints for the effect of swaying in water
  3. Motion – the fish and the bubbles.

I planned the scene in a sketch and then, using the starter code, tried to explore different ways of making the scene dynamic.

For the fish, I first, used the constructor, to make the shape of the fish and then used transparency to create an element of uniqueness in each new fish that is born on the canvas. This also enhances the effect of transparency scales and that eveything under water is bobbing and swaying.

For the motion of the seaweed, I used the random() function so that the height of the rectangle moves between two constraints, this giving the movement effect.

Please view the full code and visual preview here:

https://editor.p5js.org/ssahasra/full/R7Sh-om9z

LO-11 : Tega Brain

Keeping Time: a time visualisation with photos

Of all the women practitioners I have come across in the field of interaction design and computation, I find Tega Brain’s voice to be one of the most unique. Tega Brain uses computation and combines it with environmental interpretation of computers and her work forms bridges between computation and design as it occurs in nature. She creates computation systems/projects that respond to natural phenomena and vice versa. 

Tega Brain is an Australian-born computational designer/artist. She has a background in environmental engineering. She is a professor of New Media at NYU and is associated with Processing.org – a language similar to p5.js for visual computation.

The project I found the most interesting, especially because we recently learnt about images in p5.js is called “Keeping Time”. As described on her website – “Keeping Time portrays a complex biological system living through the Anthropocene. The series is made by scraping the Flickr database for images of particular plant species and laying the results out according to their time stamp. Photographs for each year are arranged in rows and are ordered across each row according to date.”

She uses transparency of images and their density in a given area of pixels to visualise time and the age of species. I admire that she uses images to visualise data and this project speaks to her larger body of work where she combines design with environmental phenomena.

Project 10: Visual Story Home Before The Storm

For my sonic visual story, my goal was to create a scene with simple shapes I was familiar with and I could control with my code easily and create a story with image and sound.

Visuals

I did some research online, about how artists created different scenes in P5.js (not with sounds, but only with visuals), so I could start thinking about the sequence of my story. I create simple sketches and planned which parts were non-moving and which were movable.

That helps me to categorise my code into smaller functions like function sun(); etc, and make the code as simple to comprehend as possible.

Story:

The general story was of a man trying to reach home before it is about to start raining. As cloud cover increases, he rushes home and rings the doorbell.

Sounds

I looked for short sound clips, not more than 03 seconds and successfully created a local server and preloaded them into the code.

Towards the final image

Initially, I was loading all the motion and sound simultaneously, meaning everything started at the same frameCount. But eventually I used my sketches to plan my story and have objects appear one after another. I also used the walking man from last week’s assignment, to learn how I was able to manage the variables of several objects and shapes, without having runtime errors. This was helpful to revisit, tweak the code from the old assignment and recontextualise it!

Process Video

In the initial version, my project was very noise and glitchy, but after several iterations, I was able to improve it significantly.

Mid-Process Trial Video:

Final Video after making edits:

Note: I have not embedded the code, because the sounds are on local servers and I wasn’t able to load them into the p5.js web editor.

LO-10: 1935 by Florian Hecker

“What do machines hear that humans cannot?”

For this week’s Looking Outwards, I looked up several artists and composers who work with sound as a part of their artwork. For all these artists I came across, sound is material to experiment with and create artistic expression. While several sound artists Rie Nakajima build objects as a part of the installation that create sound effects the audience can experience. Sound artists design sound for different spaces and environments which determines the quality and style of sound art.  

While reflecting on the differences between electronic music and sound art, I learnt that many sound artists use environments and physical objects to make sounds. But computer music is unique in that sense. I research the computer musician Florian Hecker – specifically with his work 1935. I chose this work, because it does justice to expressing the medium it is creating in the overall effect of the sound.

1935 by Florian Hecker:

The final project is a soundscape that varies in modulation as different data is used as input.

In the description of this video, it describes how the sound itself embodies the listening behavior of machines.He exhibits how different sound generated by adding different inputs to the computer can show measures of abstraction and scales of resolution. He also tends to personify machines and asks, “What do machines hear that humans cannot?”. He therefore truly create an effect of a different type of non-human listening, and that computers listen differently than us.

Florian Hecker is a media artist who is affiliated to Edinburgh College of Art, the MIT art program and also showcases his work and installations at leading art galleries.

Blog link: http://florianhecker.blogspot.com/

09: Dynamic Self-Portrait

https://editor.p5js.org/ssahasra/sketches/iaWwhg-Q2

The painting has a life of its own. I try to let it come through.It doesn’t make much difference how the paint is put on as long as something has been said. Technique is just a means of arriving at a statement.Every good painter paints what he is.

– Jackson Pollock

While this quote from Jackson Pollock’s celebrates a dynamic and ad-hoc approach to painting, this week’s Project was about understanding the technique even though the motion of particles and elements seems random. However, it is enjoyable to see how the code breathes life into the composition.portrait.

The project this week was an opportunity to merge different techniques from the p5.js toolkit. Mainly the two topics that I combined was “Particles” and “Images”.

I started off by experimenting with different parts of the Particles code from the in-class examples, to see how the behavior of particles changes and affects the composition. For reference, I set the image in the backdrop so that I could see the relative positions of the image in the canvas.

Merging Particles and image methods in p5.js

I used Daniel Shiffman’s tutorials to guide my process and used the steps he proposes to create code that gradually reveals the image through the scattering and random motion of particles. I used 200 particles, to create a play of “hide” and “reveal in the image.

One important thing I learnt is scaling the image correctly so that its scale aligns with the canvas created in the setup function.

Also, constraining the size of the particles and choosing the right variations contributes to a good computational portrait. For example, I ensured that the size of my particles lies between 1, 20 – if they were too big it would be harder to see what image is being rendered, but at the same time, they also do create a dramatic effect.

function Particle(x, y) {
this.x = x;
this.y = y;
this.r = random(1, 20);

As you see in the images above, I played with color value, particle size and mouse Interactions to show different textures of grain, contrast and color value in the portrait. I also used mouse Interactions to change the background so a viewer can notice the particles and how the interact.

//code citation reference
//Daniel Shiffman's Painting with Pixels:
//https://www.youtube.com/watch?v=0V3uYA1hafk&ab_channel=TheCodingTrain

var p = 2000;

var particles = [];


function preload() {
  img = loadImage('https://i.imgur.com/yprs5DW.jpg');
}

function setup() {
  createCanvas(400, 400);
  pixelDensity(1);
  //image = createCapture(img); //??
  //image.size(width / vScale, height / vScale); //??
  for (var i = 0; i 


This portrait project taught me a lot, and I was able to strategize my process much better than before. With more time, I would like to experiment with this same image using Brownian motion and a random walk of a particle.

LO-09: Learning from Peers’ Blogs

Emoji-inspired Artworks for Facebook, by Kyuha Shim

For Looking Outwards this week, I chose to review a blog from the one of the initial weeks of the course. Having joined this class late, I missed out on the first two weeks of work and that’s why I chose to use this week to review LO essays from those weeks written by peers.

I reviewed a post by Mark, where he talks about one of the artists who inspires him: Kyuha Shim. I chose this post to review because Shim, is not only a CMU professor, but also someone I had the chance to learn from, last year as I am a part of the Department of Design. Kyuha’s body of work is hugely inspired by what he calls computational design thinking.

While designers have several visual tools and software at their disposal to create and design interactions, experiences and interfaces, Kyuha’s work focuses on bringing computation into that design process and looking at computation as material. Kyuha was an artist-in-Residence at Facebook and he used computational methods to iterate graphic design compositions using deconstructed emojis.

In the process of iteration, he uses computation as material to create artworks/compositions at the frequency of “thousands of compositions in seconds” which expands the boundaries of thinking.

As a designer, this way of approaching code is inspiring. Rather than going in with an entire plan, going in with the right computational tools, can give rise to many visual design posibilities, which is true about p5.js as well as Processing

This is also a great example of an artist building up a particular practice or approach and using that approach for a versatile set of projects.

https://www.facebook.com/analoglab/videos/2163738493935595/?extid=GzpKGxeoSpyRbp7Q

LO-08 : Mimi Onuoha

Her Website: https://mimionuoha.com/

This art project of Onuoha, is called The Library of Missing Datasets

Mimi Onuoha is a creative practiioner, whose body of work illustrates her interest and expertise in seeing human patterns in data. She is a part of the Data Humanism movement in Creative Art, that artists Giorgia Lupi and Stephanie Posavec have started. She is interested in looking at how the the way information and data is modelled can reveal patterns about more than the data itself.

The thread that runs in her work is the messiness and unstructured nature of insights that run through standardised methods of measuring and collecting data for statistical methods. For example, in one of her projects she talks about, she tailed a few friends by their locations and was able to see which 2 of the 3 friends were closer to each other. Months after she was tracing patterns of their movement, the two she predicted to be close, moved in together.

Mimi Onuoha is an alum of the renowned NYU Interactive Telecommunications Program, that prides itself as being “an art school for engineers” and an “engineering school for artists”. This illustrates her creative practice very well, because her work is about unravelling the disorganization among data that seems crisp and clean, with a creative muscle for patterns.

Creative Interrogations:

Mimi calls her work during ITP as ‘creative interrogations’. These were experiments that combined research, coding, writing to dive into ideas of how data was forming the world and ideas of the individual at the same time.

Personal Stories Creative Interrogation Building of a Database or Dataset

The Point of Collection

She says that if as a professional, you have not looked at how data is collected, you have not entirely understood the data itself. Through that statement, she illustrates how data collection and personal lives are entangled. And it gets harder to question the methods of data collection as the data points become more and more.

In this way, her artwork is not only data visualisation, but it is also a commentary on bringing to our notice the biases, ease and ethical questions of data collection

Project-07: Spirographs

Interactive Spirographs with the Heart Curve

{scroll to bottom for final p5.js embed}

https://editor.p5js.org/ssahasra/sketches/HZjqQv5Q2

To create my interactive spirograph for this week’s project, my first step was to review existing curves on the Wolfram website and pick one that is simple, but can also give me exciting visuals when I use the combination of mouseX, map(), and constrain() functions.

I chose the Heart Curve, not only because it is an iconic shape/symbol but it’s parametric function allowed me to tweak the shape on all three of it’s curves.

If you notice this image, the cusp or crevice, the tip and the two mirroring bulges are the three curves that can be manipulated.

Using the given starter code, I first replaced the parametric equations and explored different types of curves, including the eight curve and the bean curve.

Finally, after fixing on the heart curve, I used the following parametric equations for the value of x and y:

a1 = 16, a2 = 13 and so on.

In the draw function, I set a1, a2 and a3 as variables and then used the mouseX to control the bulge and cusp of the heart.

Furthermore, I also added the rotate() function to setup, to reveal how the shapes create a spirograph. The frameRate() was also used to control the speed, to see the interactions and mouseX induced changes more clearly.

Here, is a video of an intermediate stage of the program:

One more important aspect of this effect is that I activated the alpha value in the fill() function so the mouseX movement also adds dynamic transparencies similar to “onion layers” in flash.

LO-07: Visualizing Information

A Visualisation Project by Stamen Design: Metagenomics with The Banfield Lab

Usually, information Visualisation examples I have seen either visualise quantified data to tell a story in compelling forms, most data visualizations on the internet are complicated, without covering the complexity of scale or information, the Metagenomics project by Stamen Design, on the other hand, takes into consideration a vast libraries of life and categorisation of species into a large map that uses a simple, excel like cell structure but encodes a vast amount of information in the way it is ordered and color-coded. This project is called “New images of complex microbiome environments”.

Erik Rodenbeck details the process of collaboration and creating this project.

https://stamen.com/wp-content/uploads/2020/06/banfield_metag.gif


Stamen Design is a data and information design studio. They partner with educational institutions and world organisations to use data and design to weave useful narratives that bring our attention to important information about our world.

As per the document published by Stamen Design, “Understanding the genomic content of an ecosystem yields incredible insight into who the dominant organisms are, the minor constituents, and all levels in between… including viruses”. Given that our lives are currently affected by a virus that seems like an abstract entity, but is a living organism with a cell-structure, this application of information visualisation to see something of a big, intangible scale is an important application of visual design in making the abstract concrete. Not only does the project encode tonnes of information, but it acts as a living document, that scientists can use as a library to understand this information.

Having been a fan of Stamen Design’s work for years, what I like about their work, is that they master the ability to encode complex information in simple geometric shapes.

From the perspective of a p5.js learner, this teaches me that I can use the simple functions of p5.js to create compelling visual information.

For example, in the image, above, I could imagine that using a mouseX, mouseY to highlight some parts of the map, and creating set of bars the heights of which can change based on the mouse position, p5.js can be used to create visualisations and paired with the backend engine of a dataset to tell stories through data.