![[OLD SEMESTER] 15-104 • Introduction to Computing for Creative Practice](https://courses.ideate.cmu.edu/15-104/f2021/wp-content/uploads/2023/09/stop-banner.png)
Alexander Chen is an artist and creative director at Google. He specializes in music visualization and experimentation in Cambridge, MA.
His educational background is focused in Engineering and Digital Media Design at UPenn.
He has worked on a number of fascinating projects as a freelancer, including a program that turns NYC’s subway system into a musical instrument.
His experience playing viola also inspired him to examine classical music such as the Bach Cello Suite and visualize it using string physics.
At Google, Chen has contributed to the Les Paul Google Doodle as well as the Chrome Music Lab.
I found Chen a very relatable and open speaker, and I think I share a similar connection to music, as I feel like visual art and music have strong ties to one another.
As a classically trained pianist/violinist, his Baroque.me project was particularly meaningful to me and opened my eyes to the possibilities of music visualization.
It changed the way I listened to a piece I’d listened to probably a hundred times before.
In terms of strategy, I was particularly impressed with the number of demos Chen had to offer the audience, which kept them engaged and entertained.
https://www.chenalexander.com/Bio
https://vimeo.com/232541082 embedding is not working 🙁
Category: SectionA
Looking Outwards – Adam Harvey
My speaker was Adam Harvey, who is an American artist and researcher based in Berlin. For college, he studied at Penn State for his bachelor’s in mechanical engineering, and at NYU for his master’s in computational photography and technology. Currently, he works in computer vision, digital imaging, facial recognition, and counter surveillance. His main work involves finding biases in facial recognition algorithms and working backwards to discover flaws in those various algorithms. While it sounds very simple, Adam’s work is incredibly important for our digital safety. Facial recognition is becoming extremely cheap to implement and combining that with the digital world producing so much free information, there is a wealth of data that is at the access of anyone at any time. Through Adam’s work, if he is able to better control and predict the way in which facial recognition will act, it will better protect us in the digital world.
In his presentation, he does a great job of connecting his pictures with his speech so that it doesn’t overload the listener with information. In addition, he does a great job of simplifying the content he is explaining, that makes it clear that he deeply understands what he is talking about, but he is giving just enough information to not overcomplicate it but make it simple enough to understand.
Link to the speaker’s website: https://ahprojects.com/
Lecture video: https://vimeo.com/channels/eyeo2019
One of their projects that I admire: https://ahprojects.com/megapixels/
LO-08
Alexander porter
I decided to learn more about Alexander Porter. Alexander is an experimental photographer. He combines an appreciation for photographic traditions with emerging computational photography and scanning methods. His work has taken him from Greece investigating the minute surfaces of artifacts, to South Korea investigating the role of video games in the lives of one of the most wired societies on earth. Alexander and James George have created DepthKit, an accessible volumetric cinema system enabling new medium for cinematic expression for the next generation of storytellers. Together they have facilitated access to this technique by teaching workshops internationally, designing open source tools for public engagement, and creating experimental films and installations. I admire how well spoken these people were in this panel. There was a lot of confidence, which made me enjoy the panel more. I thought it was interesting because they talked about virtual reality which i find very interesting.
LO8
Link of the speaker’s website:https://onyxashanti.bandcamp.com/
Link of the lecture video: https://vimeo.com/channels/eyeo2019/355843363
Onyx Ashanti is a musician, performer, programmer, and inventor of the Sonocyb, a continually evolving, malleable interface of prosthetic synthesizer controllers that Onyx 3D prints at home and uses to articulate electronic sound in conjunction with bodily motion. He discussed his perception of the essence of music, his art and their relationship with technology and human beings. As an electronic music major, his work is intriguing to me as sound and studio effects he created were all automated in a random but nice way. In his video, he talks about how he link values generated from multiple aspects of the body to automate sounds, for example, automating delay through different body movements. He is not only artistic: there’s also science and technology involved: By keeping the rhythm within the range of 1-16 hz, which is more science related, Ashanti was able to produce music that makes more sense; and by using 3D printing, Ashanti can truly wear the sensors around his body like clothes, allowing him to perform more subtle musical gestures through body gestures. I learned that I probably can try to link my artwork with myself more. since I’ve been a music producer using VSTI only, I can try to record songs instead to get a more authentic instrument feeling.
Looking Outwards 08
Hannah Davis, based on NYC, is a programmer and generative musician. She describes herself as an artist, composer and a musician who likes to find invisible structures and bring them to the surface. She has been working art and music projects that take use of machine learning, but she has also worked art on data and installations. In the past she has been working on an algorithm called TransProse, “which identifies emotions in a piece of text and translates it into a musical piece with a similar emotional tone”. Some of her newer work includes which was in creating a dataset of emotion tagged landscapes, especially getting rid of bias that exists in the actual human beings. I admire this project the most, because I do believe a lot of the things around us are biased and this can cause a lot of error, so this might be a good step into a rational error free world. She uses a lot of data to present her work effectively, which I aspire to do as well, especially making sure everything is backed with data.
All Projects
Project-07
I chose to use two curves in my project. both are hypocycloids, which I think are very interesting curves. However, while they are both hypocycloids, they behave very differently from each other. The one in the center never overlaps itself each time it is drawn; However, each time the outer curve is drawn it crossed over itself a bunch of times due to the parameters it is given. This causes a cool effect to be visualized on the canvas. I also think the colors work well together.
sketch
var nPoints = 100;

function setup() {
    createCanvas(480, 480);
    background(200,50,86);
}

function draw() {

        push();
        translate(240, 240);
        Hypotrochoid();
        Astroid();
        pop();

}

function Astroid() {
    //housekeeping
    c = color(map(mouseX, 0,480, 0, 255), map(mouseY, 0,480, 150, 200),map(mouseY+mouseY, 0, 960, 0, 255))
    stroke(c);
    strokeWeight(3);
    noFill();

    //asteroid equation
    var a = int(map(mouseY, 0, width, 4, 20));
    var b = int(map(mouseX, 0, width, 0, 100));
    beginShape();
    for (var i = 0; i < nPoints; i++){
        angle = map(i, 0, nPoints, 0, radians(360));
        x = (b / a) * ((a - 1) * cos(angle) + cos((a - 1) * angle));
        y = (b / a) * ((a - 1) * sin(angle) - sin((a - 1) * angle));
        vertex(x,y);
    }
    endShape();

}

function Hypotrochoid() {
    //housekeeping
    c = color(map(mouseX, 0,480, 150, 200), map(mouseY, 0,480, 0, 255),map(mouseY+mouseY, 0, 960, 0, 255))
    stroke(c);
    strokeWeight(1);
    noFill();

    // hypotrochoid equation
    var a = map(mouseY, 0, 480, 0, 250);
    var b = 5
    var h = map(mouseX, 0, 480, 2, 105);
    beginShape();
    for (var i = 0; i < nPoints; i++ ) {
        var angle = map(i, 0, nPoints, 0, radians(360));
         x = (a - b) * cos(angle) + h * cos((a - b) * (angle / b));
         y = (a - b) * sin(angle) - h * sin((a - b) * (angle / b));
        vertex(x, y);
    }

  endShape();
}LO-07
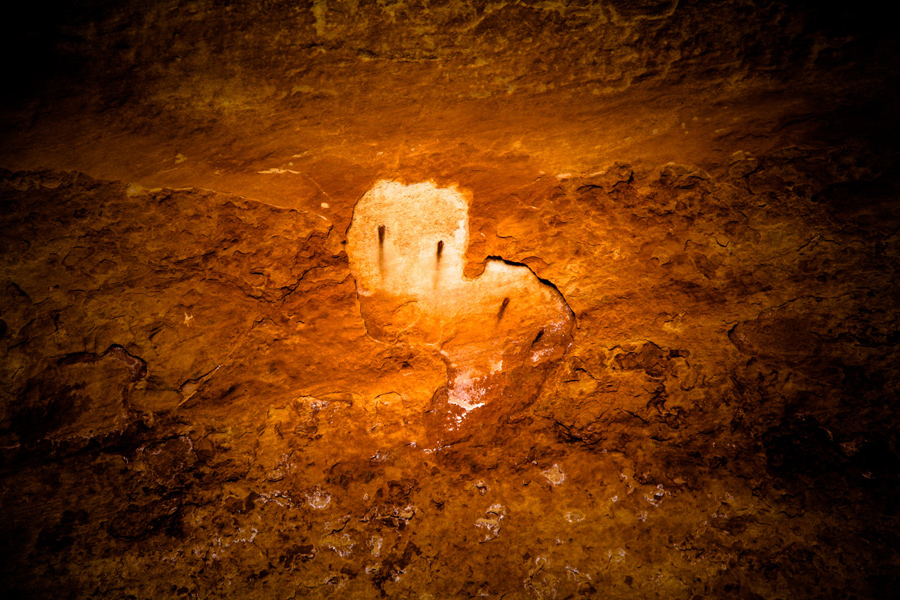
Jonathan Harris’s A Silent Place
The Looking Outwards topic for this week is computational information visualization. I chose to write about Jonathan Harris’s “a silent place.” A silent place is a pictographic oracle consisting of rock drawings from the Utah desert. When Harris visited this site in Utah, he was struck by the deep silence of the ancient images, which exist beyond interpretation— their meanings can be guessed at, but can never be known.each drawing appears for 227 seconds and reappears 227 minutes later in a cycle that continues indefinitely. Harris created a Magic 8 Ball with no words, speaking out of the silence, helping people see what they already know. I admire the fact that Harris thinks that nature can have this much power over emotions. I found this project really interesting due to the abnormal use of pictures on a website. The pictures were also very cool and presented very well on the website.
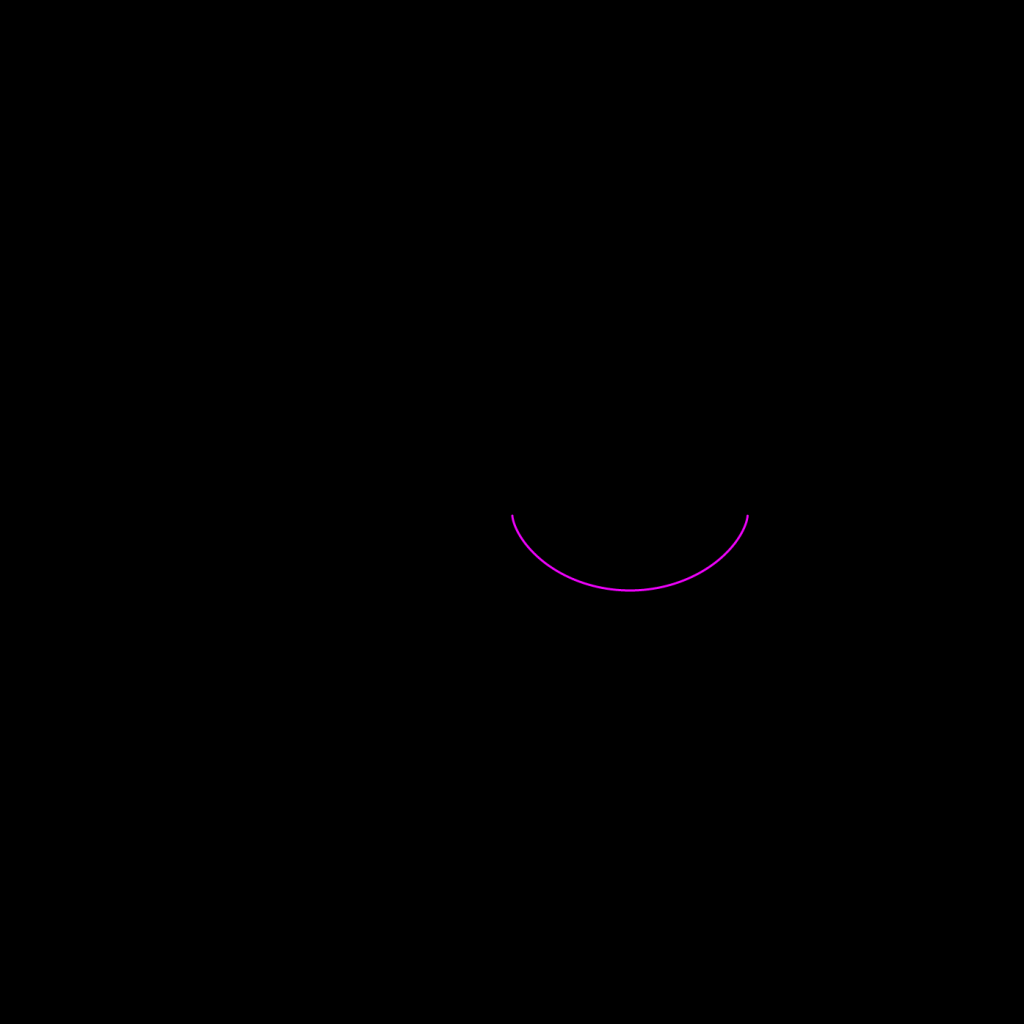
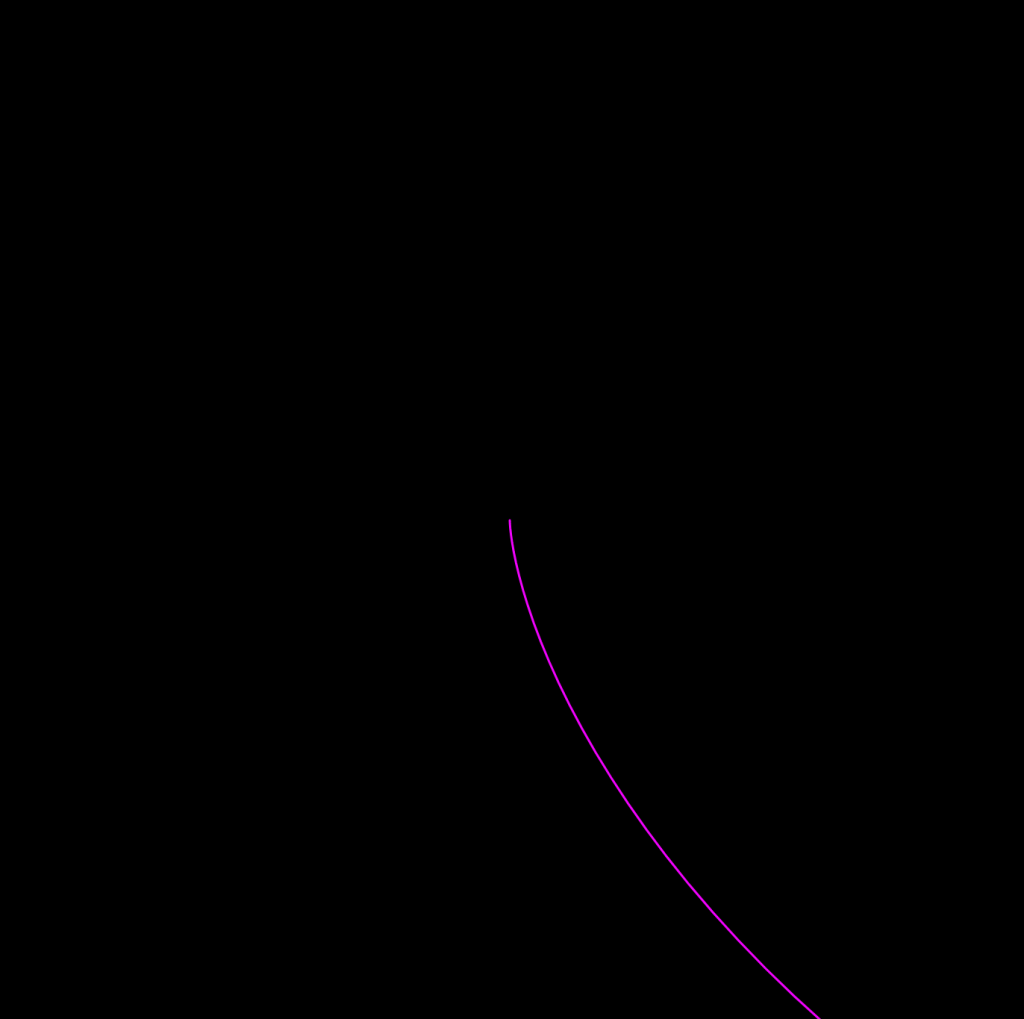
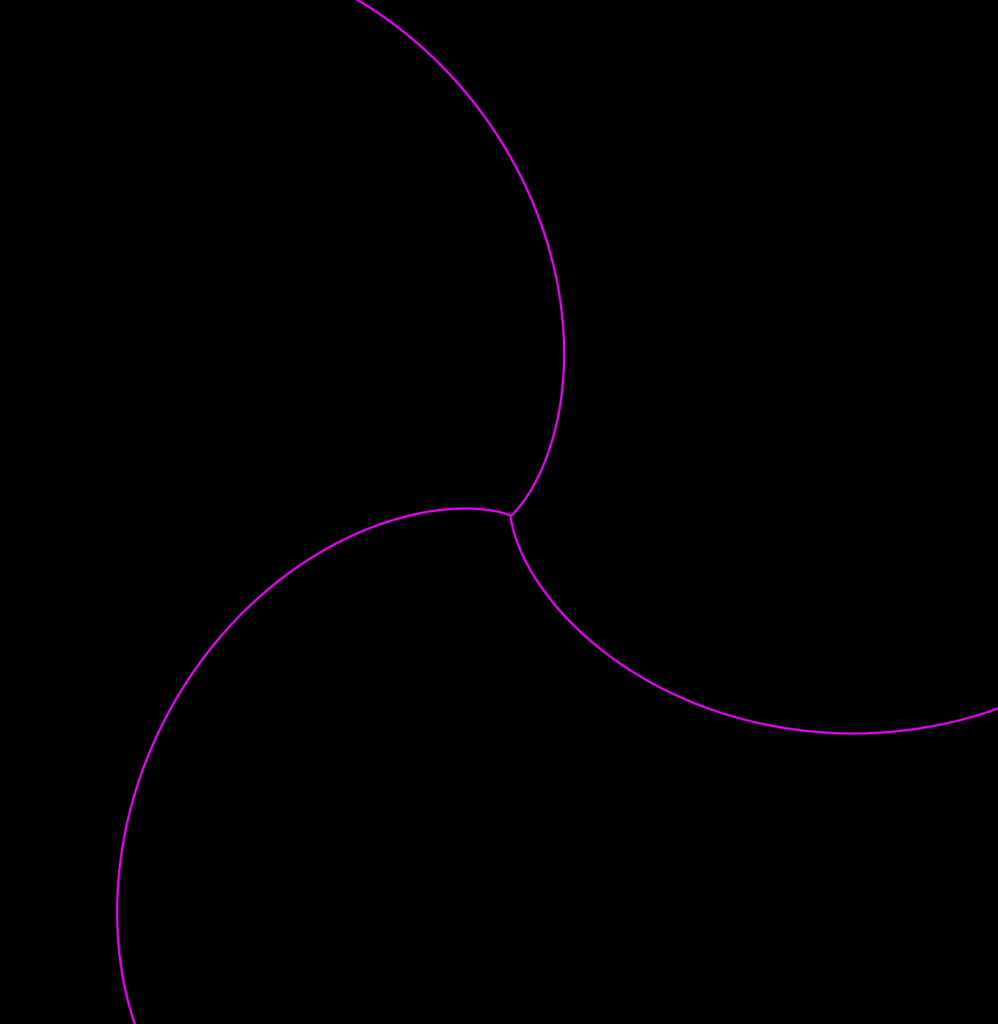
Project 07 – Composition with Curves
sketch
/* Nami Numoto
 * Section A
 * mnumoto@andrew.cmu.edu
 * Project 07 - Composition with Curves
 */

var nPoints = 100;
var CYCLOID = 0;

function setup() {
    createCanvas(480, 480);
    frameRate(10);
}

function draw() {
    background(0);
    // draw the curve in the middle and iterate 3x
    translate(width / 2, height / 2);
    for (i = 0; i < 3; i ++) {
        drawCycloid();
        rotate(90);
    }
    rotate(mouseX / 50);
}

function drawCycloid() {
    // Cycloid:
    // https://mathworld.wolfram.com/Cycloid.html

    var x;
    var y;

    var a = constrain(mouseX / 2, 0, 200);
    var b = constrain(mouseY / 2, 0, 200);

    stroke(240, 3, 252);
    noFill();
    beginShape();
    for (var i = 0; i < nPoints; i++) {
        var t = map(i, 0, nPoints, 0, TWO_PI);
        x = a * (t - sin(t));
        y = a * (1 - cos(t));
        vertex(x, y);
    }
    endShape();
}
I had a hard time figuring out the math behind the functions, but well, I guess I ended up getting it in the end. It’s not very fancy, but I iterated a Cycloid function three times to make a sort of 3-way yin&yang, minus the outer circle.
Looking Outwards 07 – Data
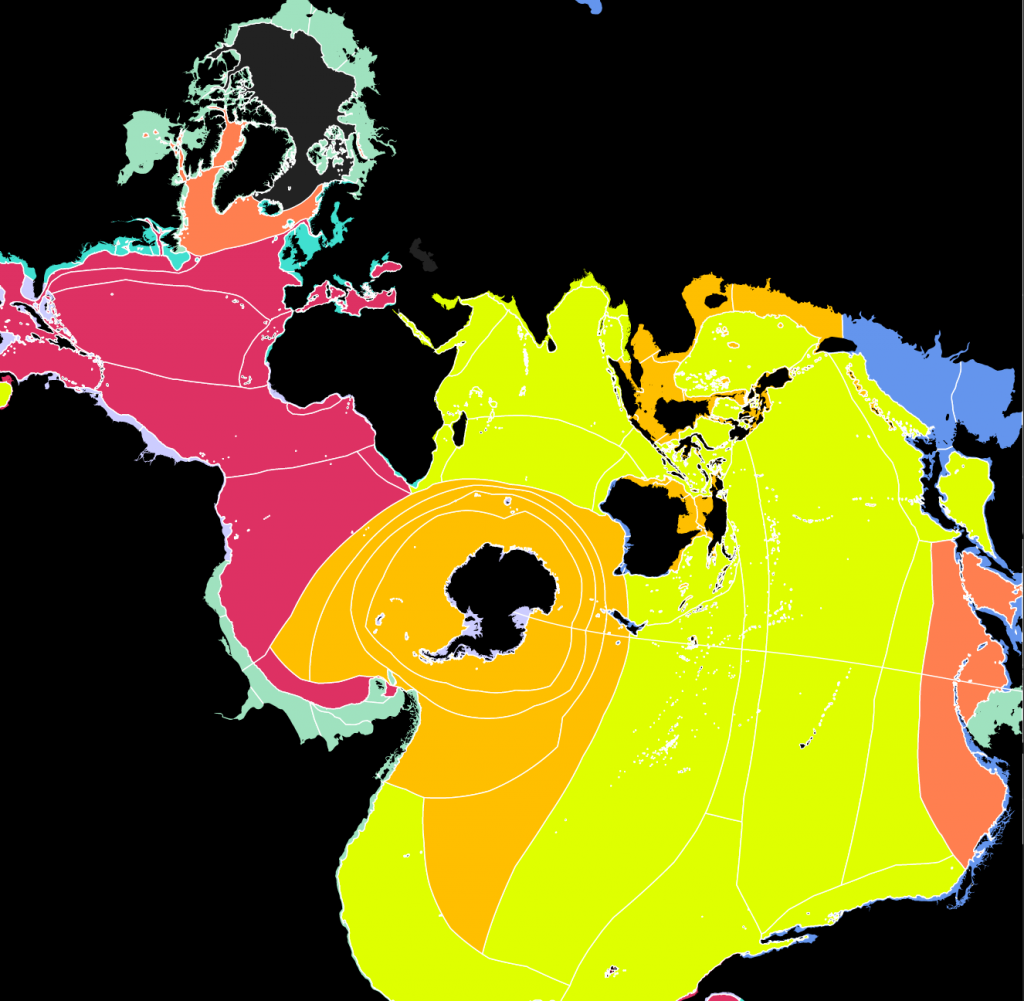
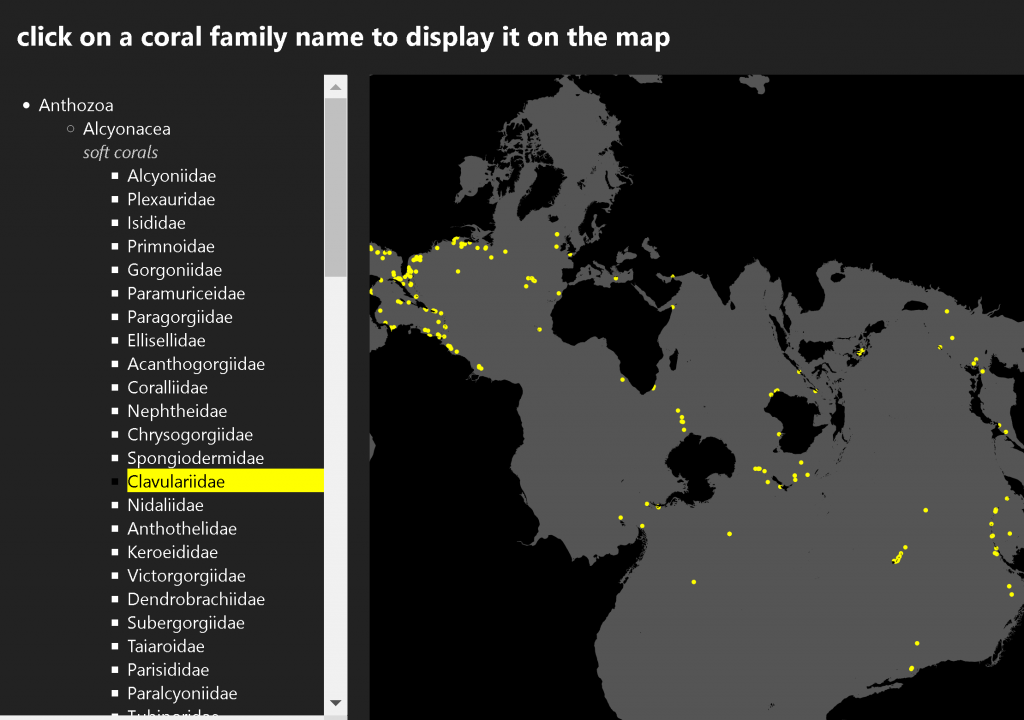
https://ocean.rachelbinx.com/coral-map (can’t embed :<)
This happens to be an ongoing project, but I looked into Rachel Binx’s “Ocean Vis” collection of maps.
Binx is a data visualization specialist who bridges locational data with
She’s created maps of the oceans and their various biomes and species (coral specifically).
It caught my eye because I’d never seen a map that highlighted the oceans and was honestly initially confused as to the orientation.
I also began to feel more critical about my internalized definition of a map – I always saw them as land-oriented before (if someone asked me to draw the contour of an ocean I’d be really lost).
Project – Cardioid Visualization
sketch
//Brandon Yi
//btyi@andrew.cmu.edu
//Section A

// Cardioid Function

var points = 200; // number of points on circle
var rate; // coefficient
var r = 180; // radius of big circle
var count = 0;

function setup(){
  createCanvas(400, 400);
  frameRate(200);
  rate = 2;
}

function draw() {
  //basic settings
  background(0);
  translate(width/2, height/2);

  //  Large White Circle
  stroke(255);
  fill(0);
  ellipse(0, 0 , r * 2, r * 2);

  // drawing lines based on cardioid shape

  for(var i = 0; i < count; i++){

    var x = r * cos(i * TWO_PI/points);
    var y = r * sin(i * TWO_PI/points);

    var x2 = r * cos(i*rate * TWO_PI/points);
    var y2 = r * sin(i*rate * TWO_PI/points);

    //color gradient based on rate

    if (rate % 3 == 0) {
      stroke(i, 0, 255-i);
    }

    else if (rate%3 == 1) {
      stroke(0, i, 255-i);
    }

    else {
      stroke(i, 255-i, 0);
    }
    // drawing line
    line(x, y, x2, y2);
  }

  //counter increases until count of 200 lines
  if(count <= points) {
    count += 1;
    frameRate(200);
  }

  //counter hits 200 -- cardioid coefficient increases + counter reset
  else {
    rate++;
    count = 0;
  }

  // coefficient reset
  if (rate >= 12) {
    rate = 2;
  }

  // brief pause
  if(count == points) {
    frameRate(1);
  }


}
I wanted to combine what we did with the line drawings and the new curves that we were trying to draw. Though it took some thinking, I think my project turned out really well.