The Atlas of Moons by National Geography is a mesmerizing set of all the moons currently present in our solar system (which I personally had no idea about). National Geographic is no stranger to beautiful images of the world around us. This visualization is a much-needed reminder of how lucky we are to be able to witness and live amongst something like this in our lifetime. According to National Geographic, our solar system hosts over 200 moons that we currently know of, including our own. The purpose of National Geographic is to broadcast nature and space as we currently know it, making it accessible to the average person. This visualization is scrollable, starting with background information to the various moons that exist in the solar system. Viewers can scroll through, compare, and get lost in space from their own homes.
var nPoints = 400;

function setup() {
    createCanvas(400, 400);
}


function draw() {
    background(0);

    // draw the curve
    push();
    translate(width/2, height/2);
    drawEpitrochoidCurve();
    pop();

    push();
    translate(width/2, height/2-20)
    drawCardioidCurve();
    pop();
}

//--------------------------------------------------
function drawEpitrochoidCurve() {
    // Epicycloid:
    // http://mathworld.wolfram.com/Epicycloid.html
    noFill();
    strokeWeight(1);

    //change color
    if (mouseX< width/2) {
        stroke(0, 50, 233);
    } else {
        stroke(81, 211, 255);
    }

    var x = constrain(mouseX, 0, width);
    var y = constrain(mouseY, 0, height);
    var a = map(x, 0, width, 50, 150);
    var b = map(y, 0, height, 1, 6);
    var h = constrain(mouseY, 50, 90);

    //draw Epicycloid
    beginShape();
    for (var i = 0; i < nPoints; i++) {
        var t = map(i, 0, nPoints, 0, TWO_PI);

        x = (a + b) * cos(t) - h * cos(t * (a + b) / b);
        y = (a + b) * sin(t) - h * sin(t * (a + b) / b);
        vertex(x, y);
    }
    endShape(CLOSE);

}


//--------------------------------------------------
function drawCardioidCurve() {
    //Cardioid
    // https://mathworld.wolfram.com/Cardioid.html
    push();
    translate(x, y);
    rotate(radians(-90))
    var x = constrain(mouseX, 0, width);
    var y = constrain(mouseY, 0, height);
    var a = map(x, 0, width, 20, 80);
    var b = a/2;

    //change color
    if (mouseY > height/2) {
        fill(233, 50, 50, 200);
    } else {
        fill(169, 22, 22, 200);
    }

    //draw cardioid
    strokeWeight(1)
    stroke(244, 82, 255);
    beginShape();
    for (var i = 0; i < nPoints; i++) {
        var t = map(i, 0, nPoints, 0, TWO_PI);

        x = a*cos(t)*(1-cos(t));
        y = a*sin(t)*(1-cos(t));
        vertex(x, y);
    }
    endShape(CLOSE);
    pop();

}
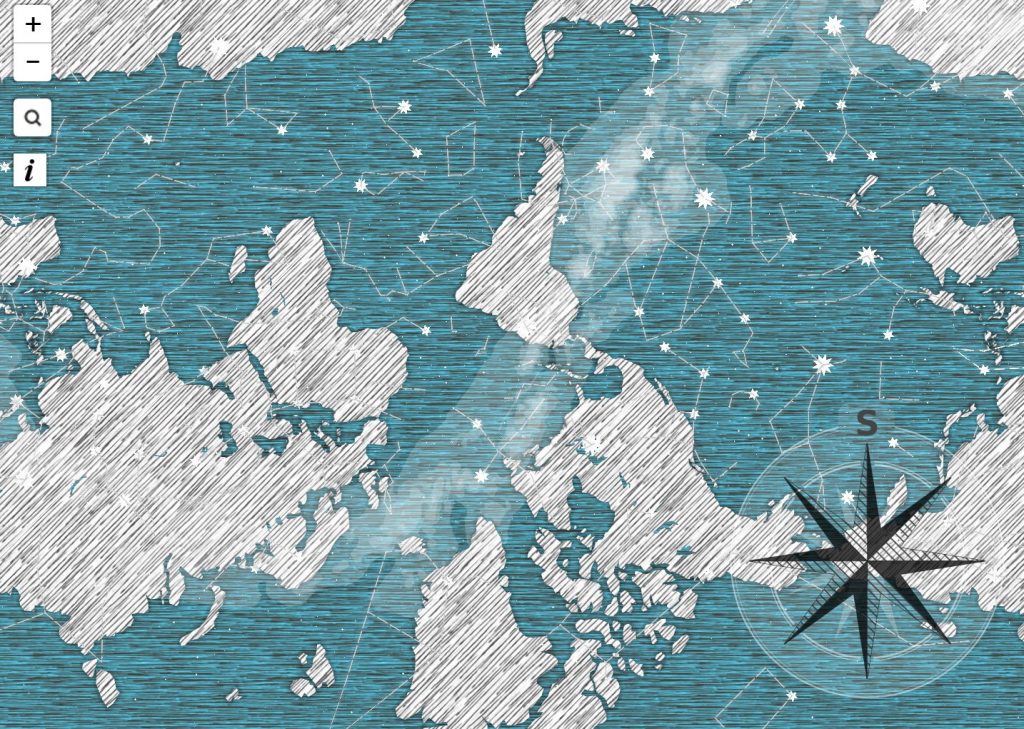
I really admired Patricio González Vivo and Jen Lowe’s map “Guayupia”, which is created for their son, and it’s a great example for discovering about data visualization. They think beyond typical standard and restrictions in creating a map: they want to use this map to tell their son where he comes from and the unlikely fact of his existence. So this is a map exploring about culture and history rather than simple numerical information. They explore South America and Argentina history from different aspects, and there are many different components in this map. The thing I found is interesting is that they also make their map become a symbol of culture: they combine stars with human, creatures and god, and they even incorporates the mass migrations of the Tupi-Guarani people.
Lowe uses basic lines and shading to construct this map. They use lines to show star, land and coastline based on history research, shading is used to show migrations. I like the color of this map and how they use uniformed ways to represent different things.
For this project, if you move your mouse left and right it changes the size of the left and right petals. If you move your mouse up and down it changes the size of the rose curve and the top and bottom inner petals.
//num of lines(rose) & size for bifoliate
var nPoints = 100;


function setup() {
    createCanvas(400, 400);
    frameRate(50);
    background(220);
}

function draw() {
    background(0);

    push();
    //moves origin to center of canvas
    translate(width/2, height/2);
    //inner petals
    draw4BifoliateCurve();
    //outer curves
    drawRoseCurve();
    pop();
}

//creating one singular bifoliate curve
function drawBifoliateCurve() {
    var x;
    var y;
    var r;

    //conforming a (which controls the size of the bifoliate) to mouseX
    var a = constrain(mouseX - 200, -100, 100);
    //opaque purple
    fill(200, 162, 230, 100);
    noStroke();
    beginShape();
    for (var i = 0; i < nPoints; i++) {
            //remap i from 0 to 2PI to create theta
            var t = map(i, 0, nPoints, 0, TWO_PI);
            //bifoliate equation
            r = ((8*cos(t) * (sin(t)**2))/(3 + cos(4*t))) * (a);
            print("Value" + a);

            x = r * cos(t);
            y = r * sin(t);
            vertex(x,y);
    }
    endShape(CLOSE);

}

//creating one bifoliate curve in y-direction
function drawmouseYbifoliateCurve() {
    var x;
    var y;
    var r;

    var a = constrain(mouseY-200, -120, 120);

    fill(200, 162, 200, 100);
    noStroke();
    beginShape();
    for (var i = 0; i < nPoints; i++) {
            //remap i from 0 to 2PI to create theta
            var t = map(i, 0, nPoints, 0, TWO_PI);
            //bifoliate equation
            r = ((8*cos(t) * (sin(t)**2))/(3 + cos(4*t))) * (a);
            //print("Value" + a);

            //change from polar to x and y
            x = r * cos(t);
            y = r * sin(t);
            vertex(x,y);
    }
    endShape(CLOSE);

}

//creating 4 Curves (Outer/Inner Petals)
function draw4BifoliateCurve() {
    push();
    //2 Petals (Top and Bottom)
    rotate(PI/5);
    drawmouseYbifoliateCurve();
    rotate(PI)
    drawmouseYbifoliateCurve();
    pop();
    //2 Petals (Left and Right)
    drawBifoliateCurve();
    push();
    rotate(PI);
    drawBifoliateCurve();
    pop();
}

//draws rose curve
function drawRoseCurve() {
    var x;
    var y;
    var r;
    var a = 1500;
    //mouse Y controls how many lines
    var n = constrain(mouseY/20, 0, 400/20);

    stroke(255, 255, 255, 150);
    strokeWeight(0.5);
    noFill();
    beginShape();
    for (var i = 0; i < nPoints; i++) {
            //remap i from 0 to 2PI to create theta
            var t = map(i, 0, nPoints, 0, TWO_PI);

            //rose equation
            r = a*sin(n*t);

            //change from polar to x and y
            x = r * cos(t);
            y = r * sin(t);
            vertex(x,y);
    }
    endShape();

}
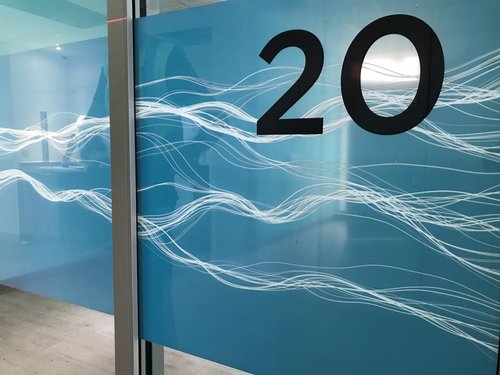
Stefanie Posavec created art at the Papworth Hospital, which was an Inpatients Ward. She was commissioned to create artwork that considered the human body and was human-scaled. Most importantly, she wanted it to be calming to patients who had just come out of surgery. I admire her work as she chose to show important computational information through understanding of the heartbeat, breath and lungs, and the blood and blood vessels that connect the two. Then, by incorporating “calming” nature she focused on aesthetics which showed waveforms (which is shown in ocean waves and heartbeats), branching (which is shown in the lungs and trees) etc. This ended up fulfilling the needs of both the patients and the staff as if offered patient privacy as well as a clear line – of-sight for nurses and staff. It was also really cool how she mapped data to concept showing how “medical data relevant to either the heart, lungs, or blood” was used as a ‘seed’ for that floor’s specific artwork.
//Xinyi Du
//15104 Section B
//xinyidu@andrew.cmu.edu
//Project-07

//Referrence Curve: Atzema Spiral
//move the mouse up and down to change the rotation angle
//move the mouse left and right to change radius

function setup() {
    createCanvas(480, 480);
    background(250);
}

function draw() {
    background(0);
    //draw the pair of lines that change with mouseX and mouseY
    lines1(mouseX, mouseY);
    lines2(mouseX, mouseY);
}

//define the function to draw the lines
function lines1 (R, A) {
    //constrain the angle and radius and map them to specific ranges
    RR = constrain(R, 0, width);
    AA = constrain(A, 0, height);
    //radius with the range(20, 20)
    r = map(RR, 0, width, 20, 50);
    //angle within the range(50, 800)
    a = map(AA, 0, height, 50, 800);

    //for loop to draw the lines and circles
    for (angle = 57.2957795; angle < 57.2957795+a; angle += 3) {
        push(); //push to save the orgin tranformation

        //translate the origin to (width/3, width/3)
        translate(width/3, width/3);
        //polar coordinates according to Atzema Spiral
        var t = radians(angle);
        var x = x3+ r * ( sin(t)/t - 2*cos(t) - t*sin(t) );
        var y = y3+ r * ( -cos(t)/t - 2*sin(t) - t*cos(t) );
        //another series of polar coordinates with 60 more degrees of angle
        var t2 = radians(angle+60);
        var x2 = x3 + (r) * ( sin(t2)/t2 - 2*cos(t2) - t2*sin(t2) );
        var y2 = y3 + (r) * ( -cos(t2)/t2 - 2*sin(t2) - t2*cos(t2) );
        //reference circle polar coordinates
        var radius = 2*r; //radius of the circle
        var x3 = radius * cos(radians(angle));
        var y3 = radius * sin(radians(angle));

        strokeWeight(0.5);
        //purple and opacity 90 of the lines from center to polar coordinates
        stroke(183, 125, 255, 90);
        line(0, 0, x, y);

        //blurish purple
        stroke(104, 81, 225);
        noFill();

        //three circles
        ellipse(0, 0, radius*2, radius*2);
        ellipse(0, 0, radius*2+10, radius*2+10);
        ellipse(0, 0, radius*2+20, radius*2+20);

        //blue
        stroke(1, 124, 228);
        //lines from first series of polar coordinates to the second series
        line(x, y, x2, y2);
        //lines from center to the reference circle
        line(0, 0, x3, y3);

        //purple
        stroke(183, 125, 255)
        fill(183, 125, 255);
        //small circles
        circle(x, y, 3);

        pop(); //pop to return to the original setting of the origin
    }

}

//rotate 180 degrees of the lines1
function lines2 (R, A) {
    //tranlate the origin
    translate(width, height);
    rotate(radians(180));
    //call the function lines1
    lines1(R, A);
}
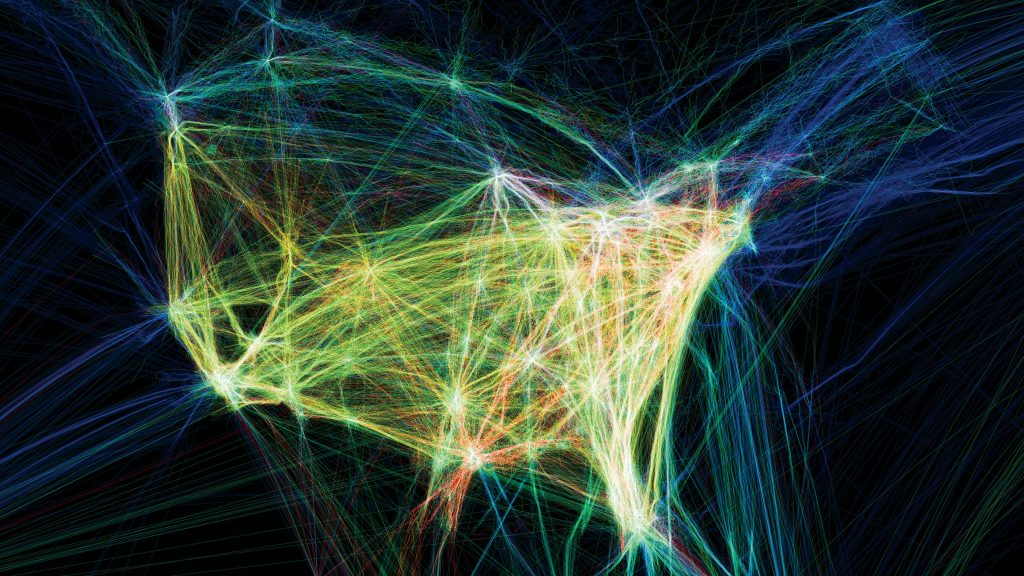
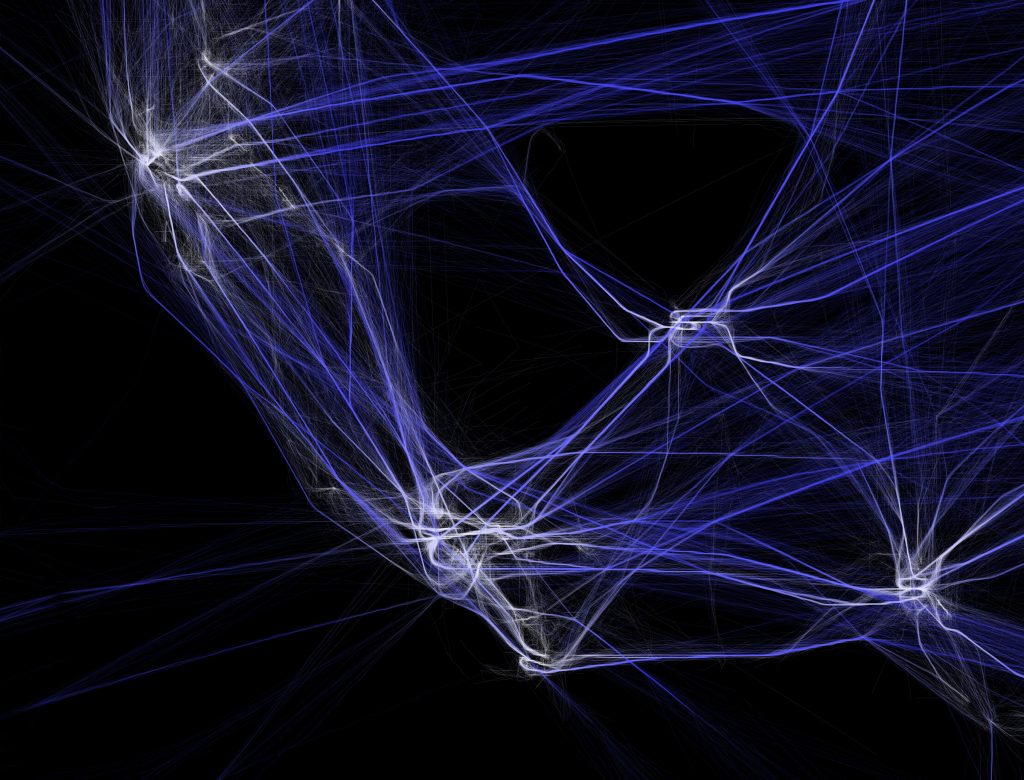
The Project is an exploration and visual representation of flight patterns in North America.
What I admire a lot about the project is that the project not only provides status images to show the overall patterns and frequency of flights in different cities but also a video to show the dynamic routes of the flights.
The data used is from Federal Aviation Administration and the Processing programming environment and Adobe After Effects and/or Maya are applied for the visualization and representation of data.
The background is set in black and the flights are set in lighter colors, and the denser the lines or the more frequent the flight routes, the brighter the colors and closer the colors to white. This use of contrast of dark background and light lines creates strong contrast and makes the flights more prominent. It is also easy to identify the places where flights are more frequent by comparing the line weights and colors. On the aesthetic aspect, the overall effects of both the diagrams and the video are very visually appealing and the lines remind the audience of lightning or fireworks.
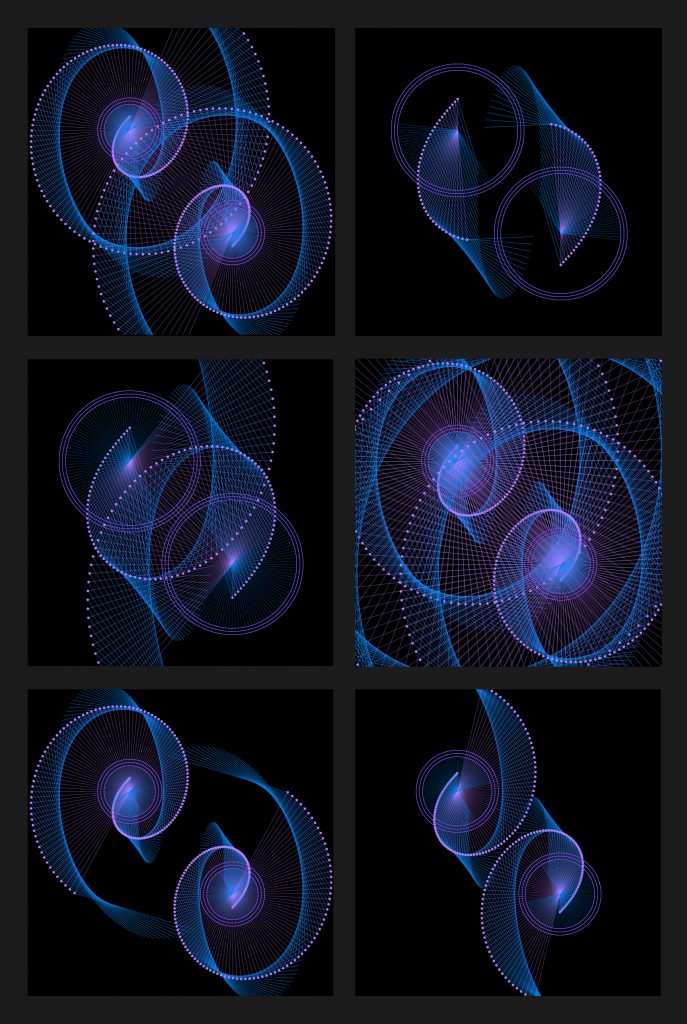
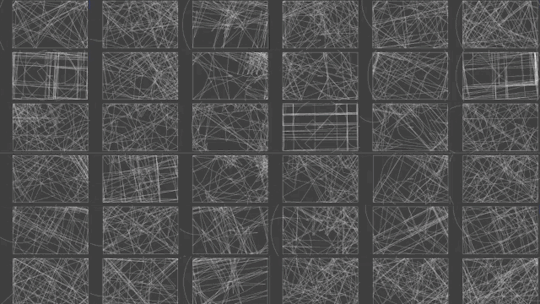
I really enjoyed this week’s looking outwards because it really let me look through a countless amounts of research and do my own research on randomness in art. This project by Aaron Tobey creates a 6×6 grid creating 36 rectangles all with it’s own unique geometric patterns, lines, and shapes. I really thought it was cool because although there’s so much going on throughout this piece of art, it’s simplicity and creativity blew me away. I suppose that this artist used some sort of computer program with random functions (maybe even p5.js haha) in order to create this piece of art.
One data visualization project that really impressed me is the work of Chris Harrison piece Word Associations Visualizing Google Bi-Gram Data. The piece portrays words on a spectrum based on a frequency. It definitely relates to the notion of arrays and traversing through different groups of data and finding different calculations (namely average and mode I’m assuming). This piece really stuck to me because it touches on a cultural/linguistic phenomenon of word association, and how the frequency of words contribute to its societal perception/usage (a feedback loop that directly influences how much a word is used).
What I especially appreciate about this piece is how natural the integration with technology and graphics was undertaken. The whole point of data visualization is to present information in a more impactful and comprehensible way. While there are many ways the idea of frequency of a list can be pretty standard, the way they organize the words in a curved composition with focal points towards the edges of the canvas really draws your eyes to see all the words and the transition between them.
//Aarnav Patel
//aarnavp@andrew.cmu.edu
//Section D
//Project

var n = 1000;
var c;

function setup() {
    createCanvas(480, 480);
    c = color(random(255), random(255), random(255));

}

function draw() {
	background(0);
	for (var i = 0; i < 3; i++) {
		drawSpiral(i * width / 2);			//draws three times
	}

}

function mousePressed() {
	c = color(random(255), random(255), random(255));
}

function drawSpiral(w) {
	stroke(c);
	push();
	translate(w, height / 2);	//Setting the origin
	noFill();
	var x;
	var y;
    var a = constrain(mouseX, 0, width);
    var b = constrain(mouseY, 0, height);		//Constrains aim to keep proportional when mouse is in Canvas


	strokeCap(ROUND);
    strokeJoin(ROUND);
    var t = 0;

    beginShape();					//Starting shape before vertices inputted
	for (var i = 0; i < n; i++) {
		var t = map(i, 0, n, 0, TWO_PI);
		x = (a + b) * cos(t) - b * cos((a + b / b) * t);		//Using the elipcycloid function for the x and y (cos and sin)
		y = (a + b) * sin(t) - b * sin((a + b / b) * t);
		vertex(x, y);

	}
	endShape();					//ending the shape
	pop();						//resetting for the next time its called

}


/*

function drawSpiral() {
	//x	=	(a+b)cosphi-bcos((a+b)/bphi)

	//=	a^2[cos(2theta)+/-sqrt((b/a)^4-sin^2(2theta))].

	noStroke();
	var a = mouseX / 4;
	var b = 50;

	strokeCap(ROUND);
	strokeJoin(ROUND);
	var t = 0;
	push();
	translate(width / 2, height / 2);
	if (a > b) {
		//push();
		beginShape();
		for (var i = 0; i < n; i++) {
			t = map(i, 0, n, 0, TWO_PI);
			var r = sqrt(a * a * ( cos(t) + sqrt(pow((b / a), 4) - pow(sin(2 * t), 2))));

			var x = r * cos(t);
			var y = r * sin(t);
			console.log(x + ", " + y)

			vertex (-x, y);
		}
		endShape();
		//pop();
	}

	//push();
	beginShape();
	for (var i = 0; i < n; i++) {
		t = map(i, 0, n, 0, TWO_PI);
		var r = sqrt(a * a * ( cos(t) + sqrt(pow((b / a), 4) - pow(sin(2 * t), 2))));

		var x = r * cos(t);
		var y = r * sin(t);
		console.log(x + ", " + y)

		vertex(x, y);
	}
	endShape();
	pop();
}
*/
![[OLD SEMESTER] 15-104 • Introduction to Computing for Creative Practice](../../../../wp-content/uploads/2023/09/stop-banner.png)