Looking Outwards 07: Information Visualization

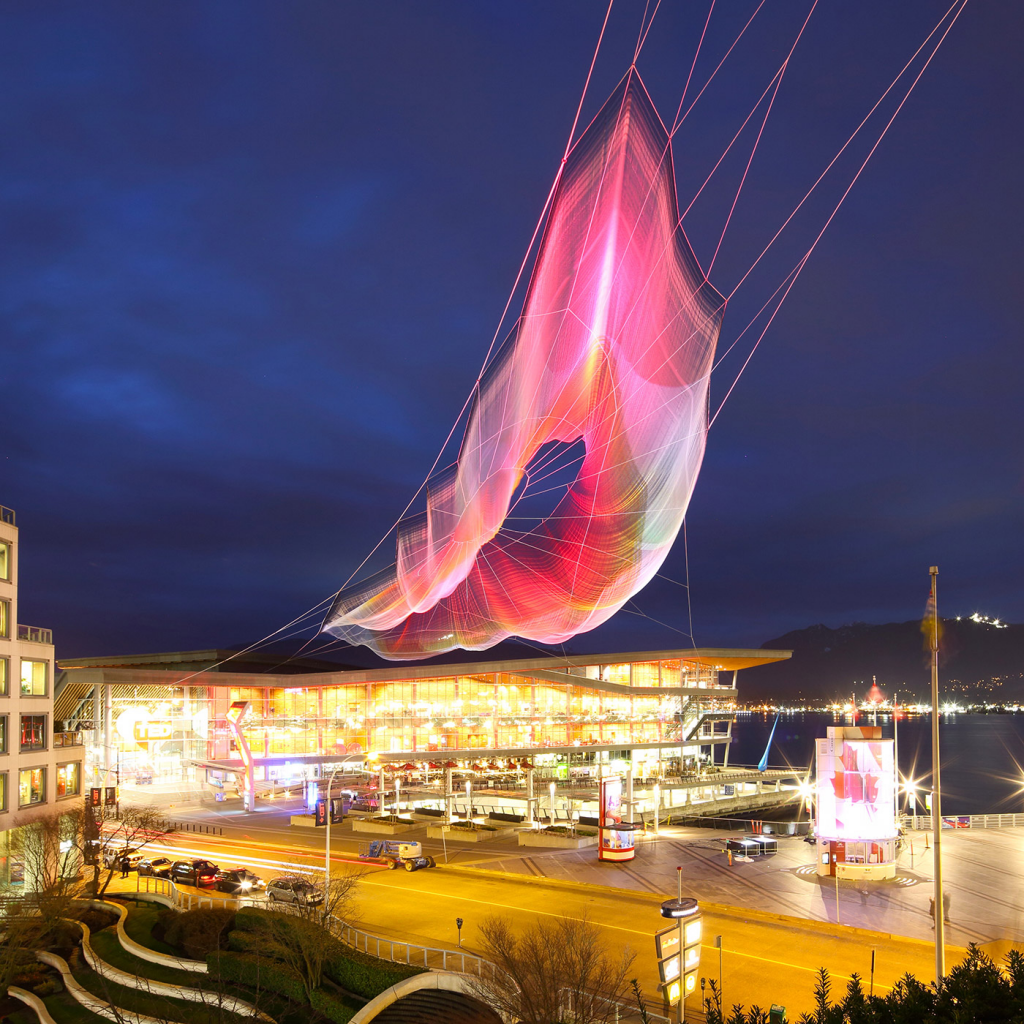
The interactive light structure, Unnumbered Sparks (2014), by Aaron Koblin and Janet Echelman was truly something spectacular to see. The concept itself—of a massive light structure that changed depending on real time audience interaction—promoted this lovely theme of unity and creativity in a very beautiful and meaningful way. The way it was constructed was also very artistic and elegant, and it was clear that Koblin and Echelman’s artistic touches could be seen through the color palettes as well as the delicate way the light filaments interacted with one another to create a stunning night sky display. In addition, the way the project was structured meant it relied heavily on focus and distance, something that the artists needed to balance in order to create something visually appealing. The algorithms involved appeared to have taken in people’s data from their phones and mapped it to some value that would allow it to alter the way the lights in the structure appeared, whether in color or shape. The way it was produced was through the usage of a website, distributed and projected onto a real, physical structure. 

Link here

Unnumbered Sparks (2014)

LO 7: Visualizing Information

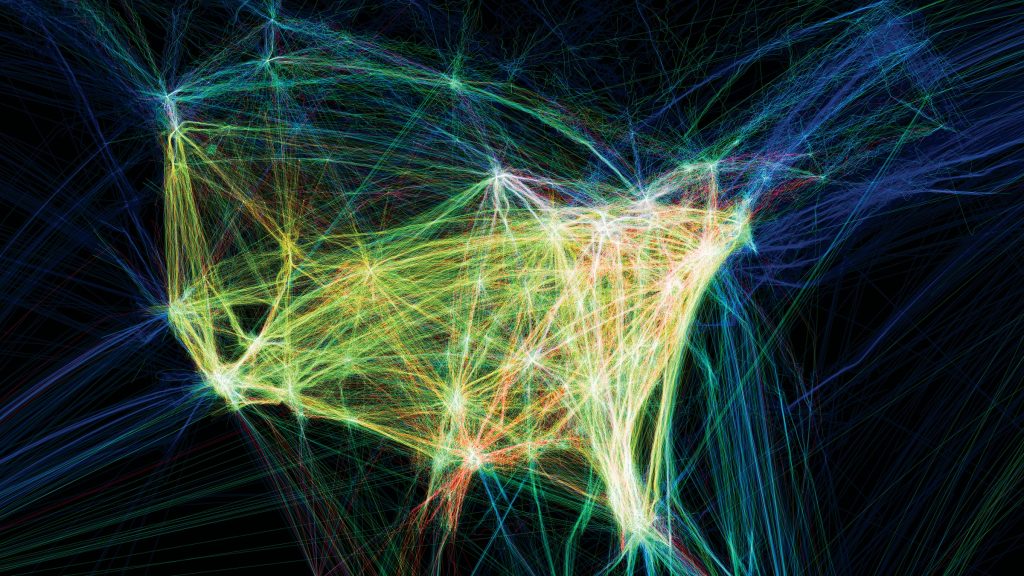
I looked at the project about Flight Patterns that represent visual information. This project plots flight patterns throughout the US visually using colors and lines. It was created as an experimental project for “Celestial Mechanics” by Scott Hessles and Gabriel Dunne at UCLA. I find this visual data intriguing because flight patterns are not something explicitly visual so it’s interesting to see what areas and cities have the most air traffic which is visually represented in this project as varying colors of lines with lighter lines as more trafficked areas. when zooming into a specific city the data is detailed enough to see the specific flight patterns within the city itself. The algorithm was developed with data that is processed through the Processing program which plots out the lines visually.

website link

Looking Outwards 07: Information Visualization

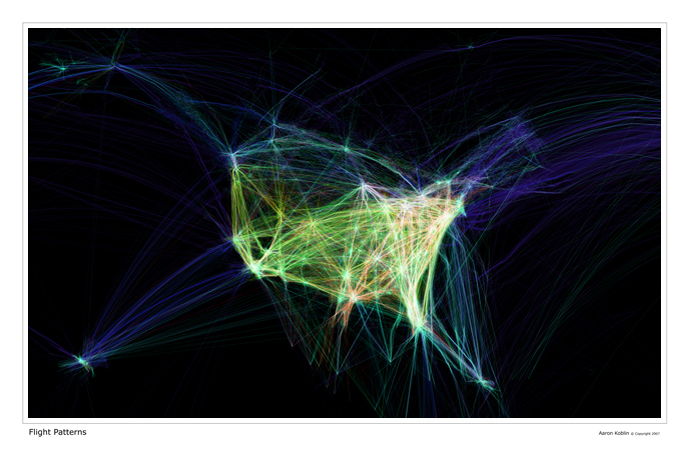
I chose to look at Flight Patterns by Aaron Koblin. This visualization of the flight data over North America was interesting to me because of how non-geometric it is. The closer you zoom into the maps, the more mycelial the shape of the flight paths become. I think we commonly believe that planes move from point A to point B along a straight line, but as we look at this map, it’s clear that that image is incorrect. I think for me it’s the mycelial nature of these flight paths, having nexuses and crisscrossing to create this intricate web that I find really intriguing. Such nonlinear patterns replete with random elements always fascinate me. The algorithms seem fairly simple and easy to understand. A flight path is charted from its beginning to its end, its x and y coordinates (latitude and longitude) mapped out using point based lines. It’s just an interesting exploration of randomness to me.

Flight Patterns (in color) by Aaron Koblin

Project-07: Composition with Curves

sketch curveDownload
/*
Sandy Youssef; 
section D; 
syoussef@andrew.cmu.edu;
Project-07;
*/

function setup() {
    createCanvas(480, 480);
    frameRate(6);
    
}

function draw() {
    // Epicloid Curve
    //https://mathworld.wolfram.com/Epicycloid.html
    background(255);
    drawEpicloid1();
    drawEpicloid2();
    drawEpicloid3(); 
    drawEpicloid4();
    drawEpicloid5();
    drawEpicloid6();
    drawEpicloid7();
    drawEpicloid8();


}

function drawEpicloid1() {
//curve located at the top right that moves according to mouse Y 
push();
    translate( width/2-100, height/2-100);
    var x; 
    var y; 

    var a = 20;; // radius of smaller circle that moves around bigger circle to create points
    var b = a * 3;  // radius
    var theta = 30;
    var move = mouseY/50
    fill(255, 0, 0, 50); // transparent pink
    beginShape();
    for (var i = 0; i < 100; i ++) {
        var theta = map ( i , 0, 100, 0, TWO_PI);
        x = (a + b) * cos(theta) - b * cos (theta * (a + b) /b * move);  // mathematical formula for the curve
        y = (a + b) * sin (theta) - b * sin (theta * (a + b) /b * move);
        vertex(x,y);
    }
    endShape(CLOSE);
    pop();

}

function drawEpicloid2() {
// same curve as drawEpicloid1 but moves in opposite direction
push();
    translate( width/2-100, height/2-100);
    var x; 
    var y; 

    var a = 20;; // radius of smaller circle 
    var b = a * 3;  // radius
    var theta = 30;
    var move = mouseY/50
    fill(200, 210, 0,50); //transparent yellow
    beginShape();
    for (var i = 0; i < 100; i ++) {
        var theta = map ( i , 0, 100, 0, TWO_PI);
        x = (a + b) * cos(-theta) - b * cos (-theta * (a + b) /b * move);  // mathematical formula for the curve
        y = (a + b) * sin (-theta) - b * sin (-theta * (a + b) /b * move);
        vertex(x,y);
    
    }
    endShape(CLOSE);
    pop();

}
function drawEpicloid3() {
// curve located at top right that moves according to mouse X
push();
    translate( width/2+100, height/2-100);
    var x; 
    var y; 

    var a = 20;; // radius of smaller circle 
    var b = a * 3;  // radius
    var theta = 30;
    var move = mouseX/50
    fill(200, 210, 0,50); // transparent yellow
    beginShape();
    for (var i = 0; i < 100; i ++) {
        var theta = map ( i , 0, 100, 0, TWO_PI);
        x = (a + b) * cos(theta) - b * cos (theta * (a + b) /b * move);  // mathematical formula for the curve
        y = (a + b) * sin (theta) - b * sin (theta * (a + b) /b * move);
        vertex(x,y);
    }
    endShape(CLOSE);
    pop();

}

function drawEpicloid4() {
// same curve as drawEpicloid3 but moves in opposite direction according to mouse X
push();
    translate( width/2+100, height/2-100);
    var x; 
    var y; 

    var a = 20;; // radius of smaller circle 
    var b = a * 3;  // radius
    var theta = 30;
    var move = mouseX/50
    fill(200, 0, 0,100); // brighter pink
    beginShape();
    for (var i = 0; i < 100; i ++) {
        var theta = map ( i , 0, 100, 0, TWO_PI);
        x = (a + b) * cos(-theta) - b * cos (-theta * (a + b) /b * move);  // mathematical formula for the curve
        y = (a + b) * sin (-theta) - b * sin (-theta * (a + b) /b * move);
        vertex(x,y);
    }
    endShape(CLOSE);
    pop();

}

function drawEpicloid5() {
// curve located in bottom right corner that moves according to mouse Y
push();
    translate( width/2+100, height/2+100);
    var x; 
    var y; 

    var a = 20;; // radius of smaller circle 
    var b = a * 3;  // radius
    var theta = 30;
    var move = mouseY/50
    fill(200, 210, 0,50); // transparent yellow
    beginShape();
    for (var i = 0; i < 100; i ++) {
        var theta = map ( i , 0, 100, 0, TWO_PI);
        x = (a + b) * cos(theta) - b * cos (theta * (a + b) /b * move);  // mathematical formula for the curve
        y = (a + b) * sin (theta) - b * sin (theta * (a + b) /b * move);
        vertex(x,y);
    }
    endShape(CLOSE);
    pop();

}

function drawEpicloid6() {
// same curve as drawEpicloid5 but moves in opposite direction according to mouse Y
push();
    translate( width/2+100, height/2+100);
    var x; 
    var y; 

    var a = 20;; // radius of smaller circle 
    var b = a * 3;  // radius
    var theta = 30;
    var move = mouseY/50
    fill(0, 210, 0,50); // transparent green
    beginShape();
    for (var i = 0; i < 100; i ++) {
        var theta = map ( i , 0, 100, 0, TWO_PI);
        x = (a + b) * cos(-theta) - b * cos (-theta * (a + b) /b * move);  // mathematical formula for the curve
        y = (a + b) * sin (-theta) - b * sin (-theta * (a + b) /b * move);
        vertex(x,y);
    }
    endShape(CLOSE);
    pop();
}

function drawEpicloid7() {
// curve located in bottom left corner that moves according to mouse X
push();
    translate( width/2-100, height/2+100);
    var x; 
    var y; 

    var a = 20;; // radius of smaller circle 
    var b = a * 3;  // radius
    var theta = 30;
    var move = mouseX/50
    fill(0, 250, 0,130); // brighter transparent green
    beginShape();
    for (var i = 0; i < 100; i ++) {
        var theta = map ( i , 0, 100, 0, TWO_PI);
        x = (a + b) * cos(theta) - b * cos (theta * (a + b) /b * move);  // mathematical formula for the curve
        y = (a + b) * sin (theta) - b * sin (theta * (a + b) /b * move);
        vertex(x,y);
    }
    endShape(CLOSE);
    pop();

}

function drawEpicloid8() {
// same curve as drawEpicloid7 but moves in opposite direction according to mouse X
push();
    translate( width/2-100, height/2+100);
    var x; 
    var y; 

    var a = 20;; // radius of smaller circle 
    var b = a * 3;  // radius
    var theta = 30;
    var move = mouseX/50
    fill(200, 210, 0,50); //transparent yellow
    beginShape();
    for (var i = 0; i < 100; i ++) {
        var theta = map ( i , 0, 100, 0, TWO_PI);
        x = (a + b) * cos(-theta) - b * cos (-theta * (a + b) /b * move);  // mathematical formula for the curve
        y = (a + b) * sin (-theta) - b * sin (-theta * (a + b) /b * move);
        vertex(x,y);
    }
    endShape(CLOSE);
    pop();
}

Looking Outwards 07: Information Visualization

Creator’s name: Stamen
Title of work: SFMoMA Artscope
Year of Creation: 2020

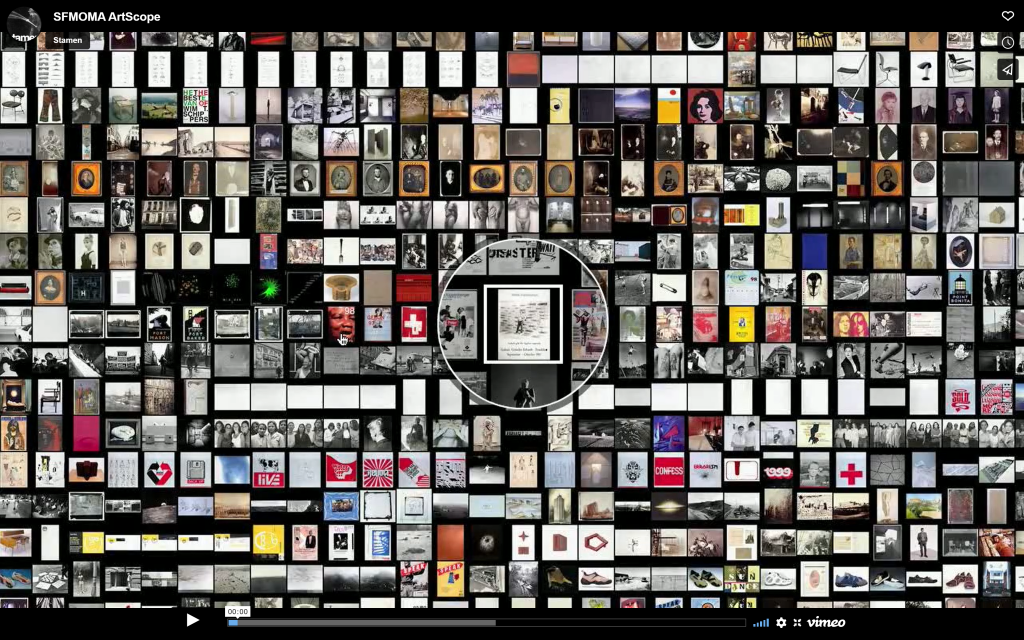
This project by Stamen is an interesting take on a museum map. It maps everything in the San Francisco Museum of Modern Art’s collection through images of the displays that are currently in the museum. Using an interactive mapping technology known as “Modest Maps ”, this software creates a virtual environment where individuals can zoom and pan through artworks that are arranged depending on when and where they were bought to be displayed in the museum. I find this design to be quite a unique way of displaying information organized chronologically. As opposed to a website where the user scrolls down, this format instead creates a much more interactive and easy-to-understand approach. I would assume that the algorithm used to generate this work involves arrays that organize the works by date of purchase. In addition, I would assume that there is another array that considers where the artworks were bought since there must be a way to store such a large amount of information in order to organize it. The designer’s artistic sensibilities are present in this work since it complements their other work to create a cohesive style and approach to visual communication. This style is even present in the design of the website itself.

https://stamen.com/work/sfmoma-artscope/

Screenshot of the map

Looking Outwards 07

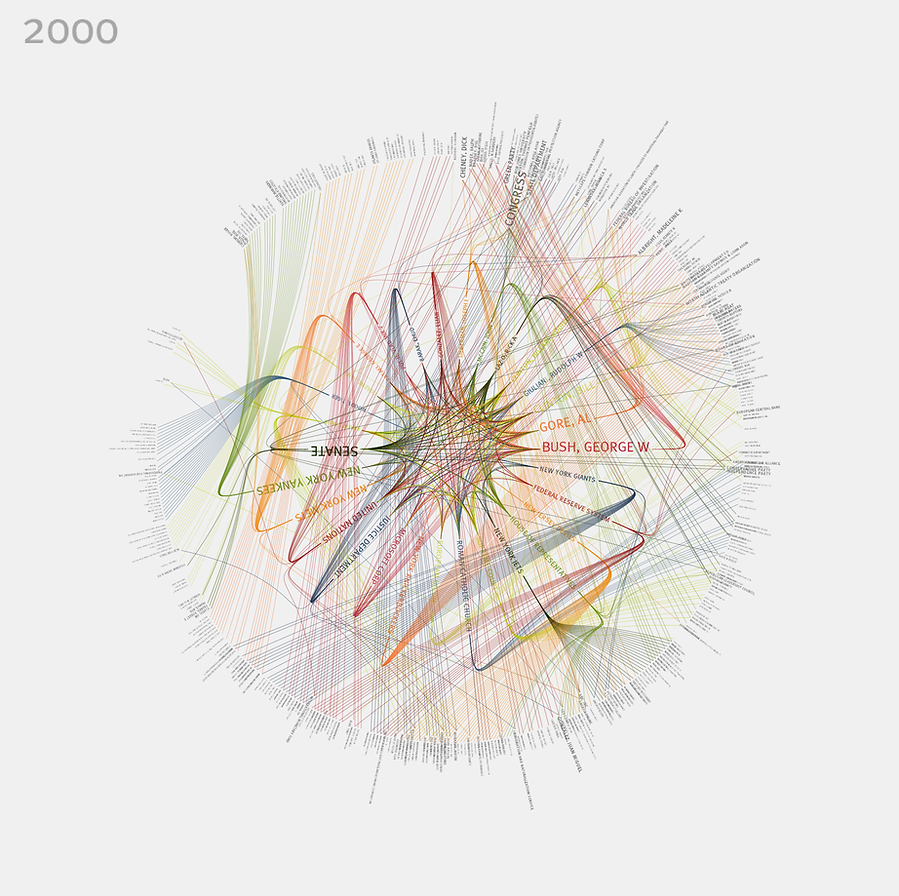
The work I selected is 365/360 by Jer Thorp . The work is a visualization that shows the top organizations and personalities every year from 1985 to 2001. The work was created for the New York Times and links people, organizations and events. I selected this work because I was interested in the way Thorp used color and font size as a form of connection in addition to simply lines of connection. This makes the representation of data feel quite dynamic and life like. The piece of work is also circular which shows just how interconnected seemingly different topics are. The work also gives us a sense of Thorp’s sensibilities when it comes to representation and color and font use.

Project-07-Curves

Astroid

sketch
//Brody Ploeger
//Section C
//jploeger@andrew.cmu.edu
//Project-07


var nPoints = 150
function setup() {
    createCanvas(480, 480);
    background(220);
    //text("p5.js vers 0.9.0 test.", 10, 15);
}

function draw() {
    background(0);

    push();
    translate(width/2,height/2)
    //astroid 1
    stroke('orange')
    noFill()
    astroid(0,0);
    //astroid 2
    stroke('lightblue')
    noFill()
    astroid2(0,0);
    pop();
}

function astroid(x,y,q,w){
    //https://mathworld.wolfram.com/Astroid.html
    var x;
    var y;
    

    var q = map(mouseX,0,width,0,5);
    var a = constrain(mouseX,0,width/2);
    var b = constrain(mouseY,0,height/2);
    var w = constrain(mouseY,0,height);

//shape
    beginShape();
    for (var i = 0; i<nPoints; i++){
        var t = map(i,0,nPoints,0,TWO_PI)
        
        x= a*pow(cos(t*w),3)
        y= b*pow(sin(t*w),3)
        rotate(radians(q))
        vertex(x,y);
    }
    endShape(CLOSE);


}
function astroid2(x,y,q,w){
    //https://mathworld.wolfram.com/Astroid.html
    var x;
    var y;
    

    var q = map(mouseX,0,width,0,5);
    var a = constrain(mouseX,0,width/2);
    var b = constrain(mouseY,0,height/2);
    var w = constrain(mouseX,0,height);

//shape
    beginShape();
    for (var i = 0; i<nPoints; i++){
        var t = map(i,0,nPoints,0,TWO_PI)
        
        x= a*pow(cos(t*w),3)
        y= b*pow(sin(t*w),3)
        rotate(radians(q))
        vertex(x,y);
    }
    endShape(CLOSE);


}

anabelle’s blog 07

http://manovich.net/index.php/exhibitions/on-broadway

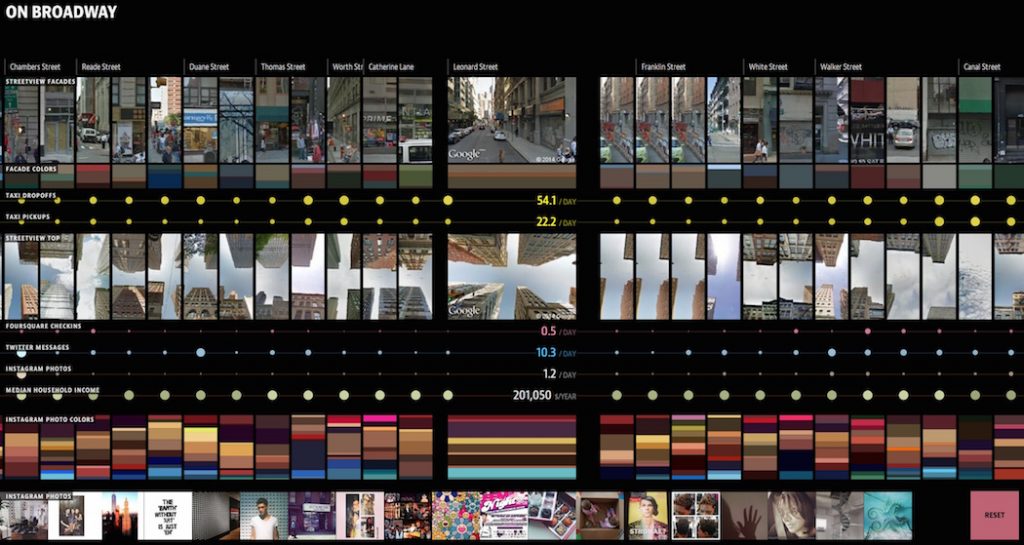
One work I found inspiring was Lev Manovich’s “On Broadway.” It resonated with me for two reasons: one, I’m writing this blog while in NYC (hence, Broadway) and two, I appreciate the lack of numbers and traditional data in the project. Overall, I’m not too big on STEM and mathematics, so this feels like a unique approach that tries to broaden the statistical audience to the average math hating person. I also think this approach was generally successful — anyone who views this gains a comprehensive survey of Manhattan even without the physical data (I mean, I find that when I’m reading actual statistics, I generally gloss over the figures and take away the big idea more than anything else anyways). I also liked this project because I felt as if it was something even I could recreate (albeit on a smaller scale). It seems like a lot of data storage (and we’ve learned about NUMEROUS ways to represent and store data already) and visual representation (and this is a creative computing class!). It’s inspiring to think large projects like this are within my reach

LookingOutwards-07

This week I am looking at the work of Lev Manovich. Manovich is a digital culture theorist, writer, and artist. A lot of his work looks at media and technology. His project On Broadway, is an interactive application and pubic installation piece. The piece looks at data from Broadway in New York City, however, the data is not presented in a normal way with maps, numbers, and charts. In this project numbers are secondary to data in the form of images grabbed from social media and the internet. These images were taken from six months in 2014. The project showed how the city can be represented through the view of the hundreds of thousands of people posting images.

http://manovich.net/index.php/exhibitions/on-broadway
http://on-broadway.nyc/

LookingOutwards-07-UCSF Health Atlas

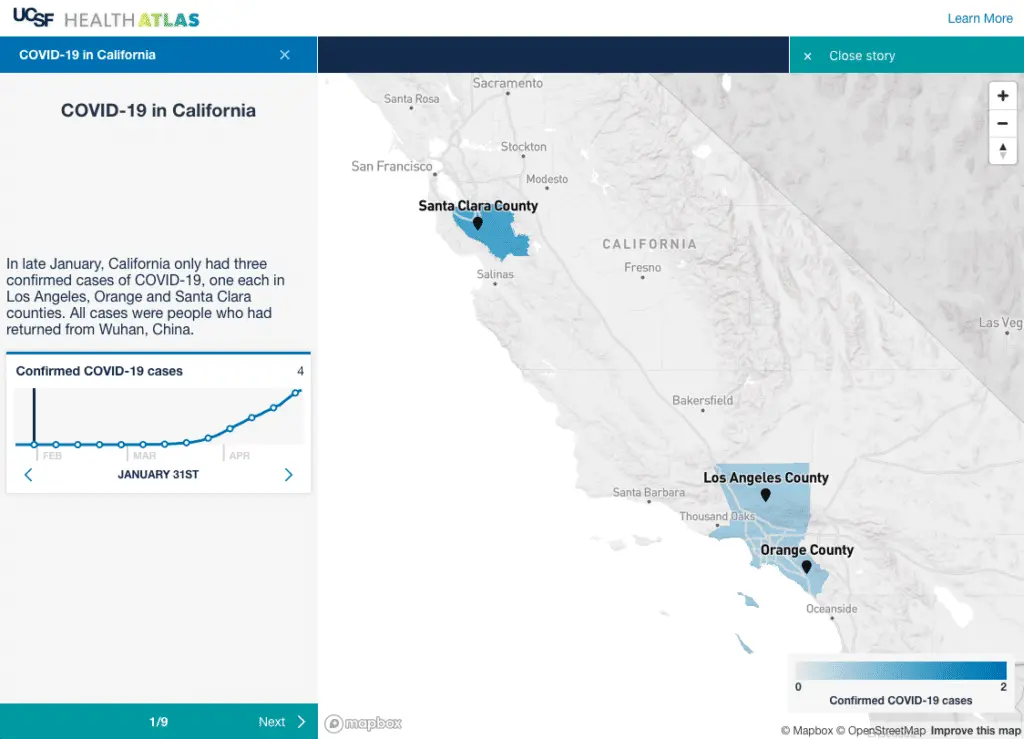
The UCSF Health Atlas is an online software that visualizes Covid 19 pandemic cases in all the counties in California. I admire its purpose, which is to explore the influence of “socioeconomic and environmental factors” during the pandemics, which means the project is based on census tract at a county level, and it allows us to see the detrimental influence of pandemics with our eyes.

For the Algorithm, I believe that it imports census Datas and data of covid cases into the website. Then the web divides the cases into different data sets on a county level and uses different coloration to represent the severity of the pandemic. The blue the county is on the map, the more covid cases it has, and yellow represents the amount of people who died from the pandemic in that county.

The artistic sensibilities manifest in the final form of a map of blue California that shows the number of the covid cases based on its lightness, because the darker colors mean more cases. I hope it becomes a map of the whole planet in the future, so people all over the world can know when to be cautious about pandemics.

Link: UCSF Health Atlas Author: Collaboration of UCSF School of Medicine Dean’s Office of Population Health and Health Equity led by Debby Oh and Stamen Design Year of Creation: 2020(To my best Knowledge)