This project intrigues me in its aspect of collecting and visualizing relatively intangible data, which are represented by feelings and emotions. In collaboration with social scientists and data designers, the initial idea of creating a single map grew into a collection of maps that analyze different emotions individually (anger, fear, sadness, disgust, and enjoyment). Because there are no preexisting data models of emotions, researchers and designers worked together to draw out many rounds of visualizations on paper first and translated those onto the actual model.
This project’s primary goal was to resolve the gap between academic findings and personal experiences. The methodology of solving these questions is through data visualization that first had to begin with sketching discussions and first-hand data collection.
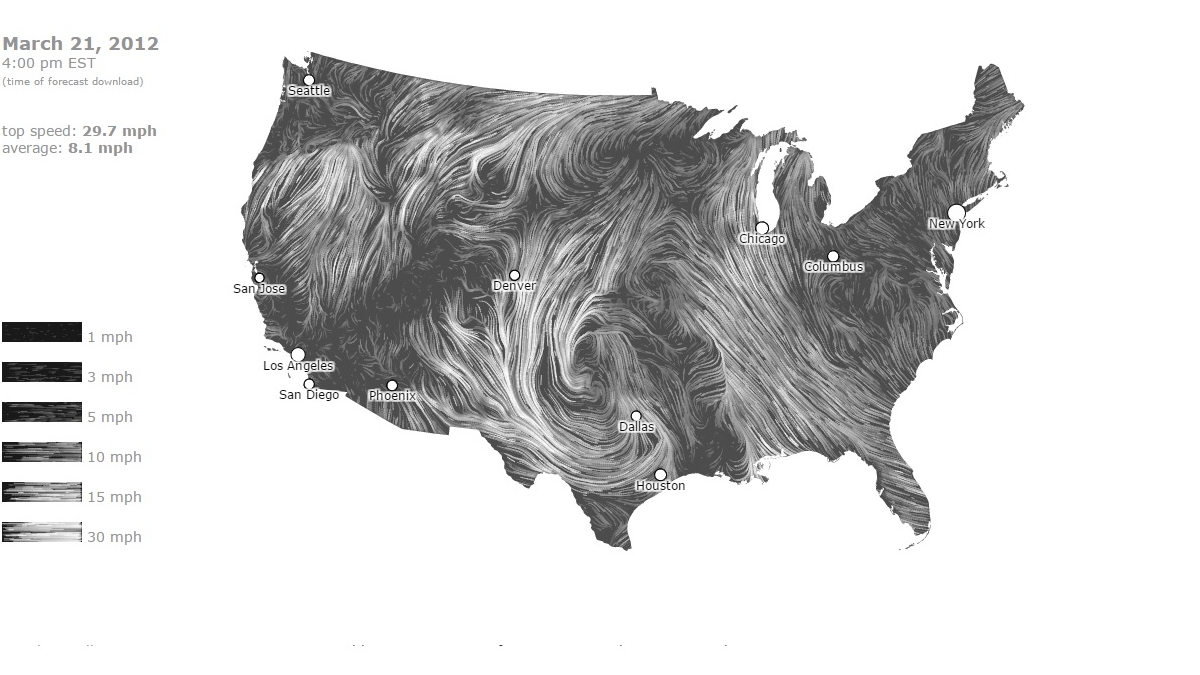
I find this project extremely intriguing because of the many uses it provides that even the creators themselves have not anticipated. The Wind Map, created by Fernanda Viégas and Martin Wattenberg, shows real time wind data that comes from the National Digital Forecast Database. The technique includes using “comet-like trails to show motion”, and is derived from Edmund Halley in 1686. The project itself is entirely implemented in HTML and JavaScript.
The creators intended this project to be an emotional approach and artistic exploration that shows people where and when hurricanes and wind storms happen. I think it is fascinating that such a beautifully crafted project is constantly updating so people can relate and send hopes to areas with dangerous wind activity. The aesthetics of this project are extremely captivating: during times when the wind is calm, the make also looks serene and meditative. However, when there are severe hurricanes, large white strokes illustrate very scary movement that resembles lightning and chaos.
Furthermore, I am more fascinated that people have found unique ways to utilize this map. For example, bird watchers have used it to examine bird migration and cyclist have used it to plan for their trips. The use of a project like this can vary from the research level (ex. Architects studying site conditions), to a local or personal level (ex. Planning for a family trip). This is extremely captivating for me.
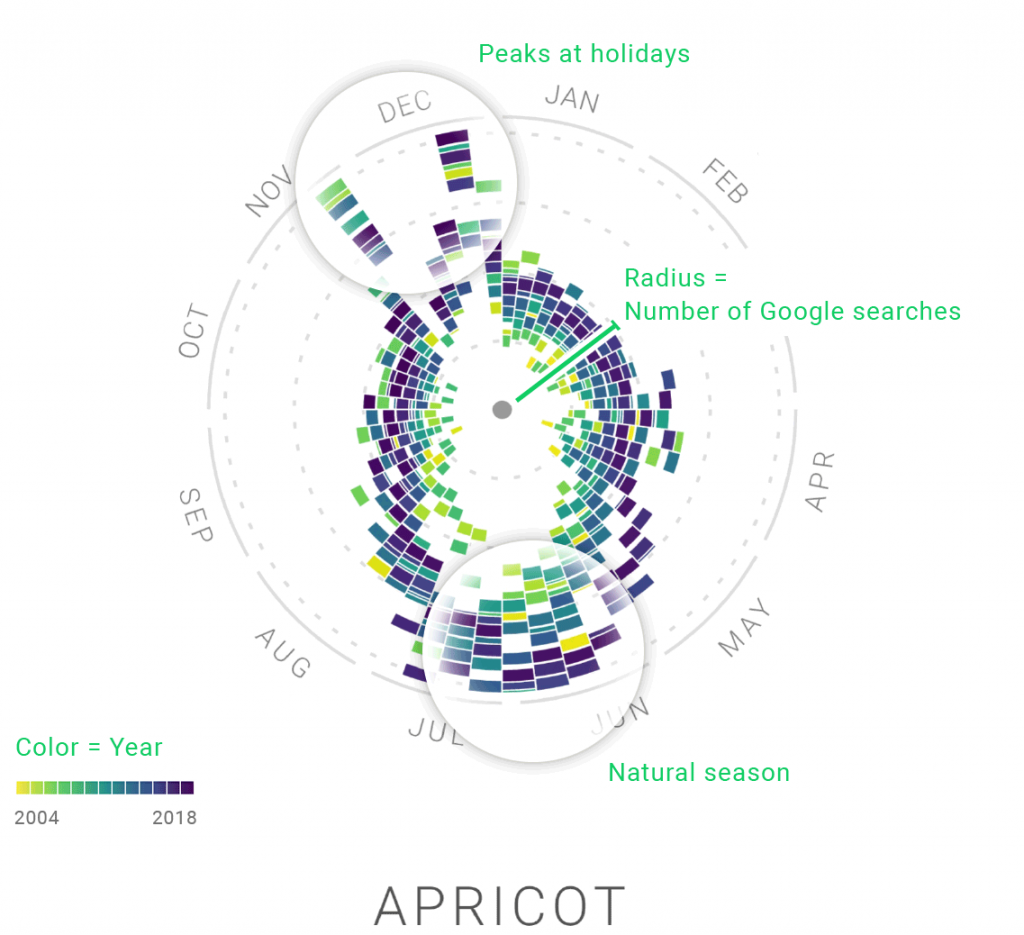
The project I choose is about visualizing several food searches on the Internet. The designer Moritz Stefaner investigates how people change preferences for particular food over months and years and how it creates a rhythm to showcase the seasonality of food queries. I love how they investigate this topic from many aspects, such as among different countries, different food, or different time.
Stefaner also puts a lot of effort into visualizing how food queries change monthly and yearly. He designed a circle with bars surrounding it clockwise to show different months. Each bar represents the number of times a keyword is searched. After that, he overlayed bars on one another with different colors across different years. Furthermore, he creates an animation to visualize the process more clearly. The rigidity in the structure of the data and clarity in its presentation makes me admire his effort.
Visualizing change in food searches
Finally, Stefaner also provides clues to help the audience understand patterns in data. For example, in months with holidays like Halloween and Christmas. He puts a marker on that day in the graph to show how the frequency of food searches might change around that day.
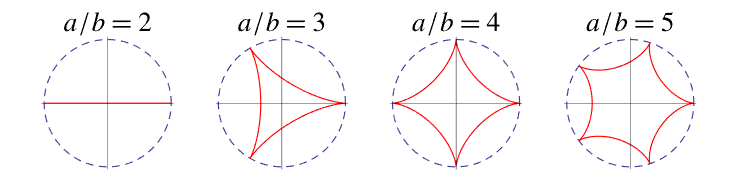
This is my curve project. I am using mouseX to control the rotation, scale, and color of curves while using mouseY to control the number of iterations. Also, when you click, the curve changes. I really like how Hypocychoid and Epitrochoid are constructed and how different iterations of them overlap one another.
//Jason Jiang
//Section E

//Setting up variables
var nPts = 200;
var a = 80;
var N;
var b
var x;
var y;
var crvMode = 1;


function setup() {
    createCanvas(400, 400);
    frameRate(10)
    colorMode(HSB);
    }


function draw() {
    //Mapping mouseY value to number of iterations
    N = map(mouseY, 0, height, 0, 25);
    b = a/N;
    background(0);

    //Draw Hypocychoid
    if (crvMode%2 == 0) {
    for(var i = 3; i <= N; i++) {
        //Decreasing strokeWeight each iteration
        strokeWeight(2-i*0.05)

        //Changing color according to mouseX
        stroke(255-mouseX*0.1, 100-i, 200-i*5)
        crv1(i);
        stroke(255-mouseX*0.1, 100-i, 100-i*5)
        crv1(PI+i);
    }
}
    //Draw Epitrochoid
    else {
        for(var i = 3; i <= N; i++){
            //Decreasing strokeWeight each iteration
            strokeWeight(2-i*0.05)

            //Changing color according to mouseX
            stroke(mouseX*0.1, 100-i, 200-i*5)
            crv2(i);
            stroke(mouseX*0.1, 100-i, 100-i*5)
            crv2(PI+i);
        }
    }
}

//Hypocychoid
function crv1(m) {
    //Changing scale and rotation according to mouseX
    h = map(mouseX, 0, width, 1, 2, true)*m*0.05;
    angle = map(mouseX, 0, width, 0, PI);

    push()
    translate(width/2, height/2);

    //Rotate curve according to mouseX
    rotate(angle + m);

    //Drawing curves
    noFill();
    beginShape()

        for(var i = 0; i < nPts; i++){
            var t1 = map(i, 0, nPts, 0, TWO_PI)
            var t2 = t1*(a-b)/b
            x = h*((a-b)*cos(t1)+b*cos(t2))
            y = h*((a-b)*sin(t1)-b*sin(t2))

            //Adding random movement to the curve
            vertex(random(x+4, x-4), random(y+4, y-4));
        }
    endShape(CLOSE);
    pop();
}

//Epitrochoid
function crv2(m) {
    //Changing scale and rotation according to mouseX
    h = map(mouseX, 0, width, 1, 2, true)*m*0.05;
    angle = map(mouseX, 0, width, 0, TWO_PI);

    push()
    translate(width/2, height/2);

    //Rotate curve according to mouseX
    rotate(angle + m);

    //Drawing curves
    noFill();
    beginShape()

        for(var i = 0; i < nPts; i++){
            var t1 = map(i, 0, nPts, 0, TWO_PI)
            var t2 = t1*(a-b)/b
            x = h*((a-b)*cos(t1)+b*sin(t2))
            y = h*((a-b)*sin(t1)-b*cos(t2))
            vertex(x, y);
        }
    endShape(CLOSE)
    pop();
}

//Change curves when press mouse
function mousePressed(){
   crvMode++
   print(crvMode);
}
The work of Jonathan Jennings Harris most inspires me. He is an artist and technologist who often works with data. One piece of work that I found particularly interesting was “I Want You To Want Me” which he created in 2008. It is an interactive portrait illustrating the search for love(and self) through online dating. In this project, Harris and his team gathered data from hundreds of dating sites and displayed them in a series of interactive ways. On a touchscreen panel, many balloons are displayed in various colors. Pink for women and blue for men. The balloons also vary in value, with younger people having lighter-colored balloons and older people having darker-colored balloons. Inside the balloons lie animated silhouettes of people trapped inside looking for love. These balloons are then algorithmically matched on the screen based on what people said in their profiles. The user is able to click on a balloon to learn more about each person.
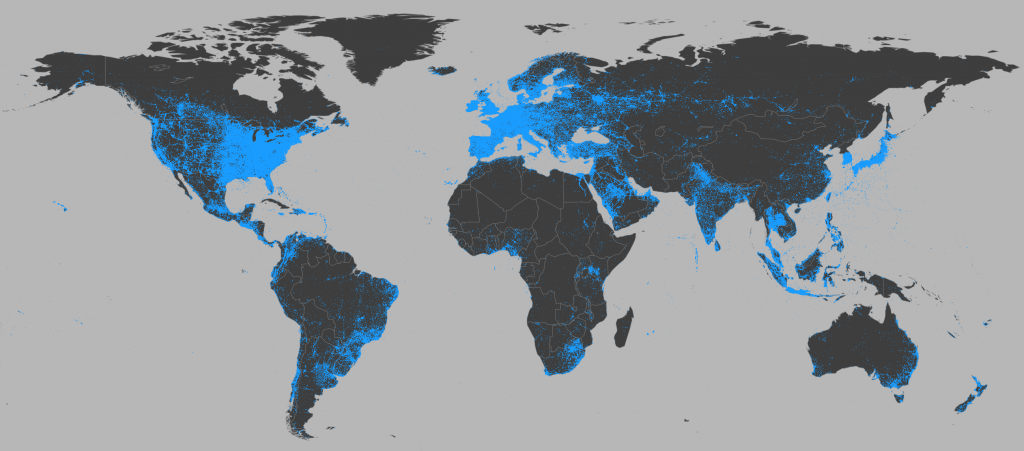
To better understand Computational Information Visualization, I looked into the Visual Earth project led by Dr. Lev Manovich. It’s a really cool project that compiles data about images and photographs on the internet on a visual map of the earth in order to understand global growth trends better, and how our visually heavy spaces online vary geographically in relation to various factors like economic and cultural differences. They compute this by using images from Twitter that have the locations tagged. However, they mention only processing a part of the total data set they collect (100 out of 270 million) which is done through a random process much like the ‘random’ function in p5.js. The visual form of processing and communicating this massive amount of information is really useful in allowing people to visually process different rates of image sharing as they are influenced by things like income or even geographical landscape.
This work immediately intrigued me because of its nostalgic draw, but the arrangement and presentation itself make it become a truly standalone artwork. The method of extracting data that Ben Fry uses throughout his work really made me think about how data, in itself, doesn’t really mean anything unless assigned to a certain context or presentation. For example, All Streets is about the concentration and representation of roads in the USA on a map; however, the actual illustration of the data combined with the contextualization of what that data represents geographically, which is in constant engagement with how audiences interact with the map when making sense of it in their intersubjective interpretation of the map (what they call home, what they’ve assumed borders were, what they’ve assumed population/road densities were in certain places).
Thus, in Mario Soup, this method becomes even more meta. The data itself that was specifically made for art is revealed to the audience to be nothing more than pixels of color themselves by the reorganization of that data. Especially interesting is that this was how the data was arranged by the programmers of the game for the utility of the game itself, so utility organization has been flipped on its head as an aesthetic itself when was supposed to be the means of a different aesthetic–that for a game. This was done by decoding the raw data of a Nintendo game cartridge as a four-color image, according to Fry.
The codex Atlanticus is a digital collection of drawings and texts by Leonardo da Vinci which is a part of the original collection at Biblioteca Ambrosiana in Milan. The creators of this digital archive have utilized data for storytelling and visualize information through various filters with which the user can unravel information of a particular document, beyond what is specified in it. The most interesting part is how the interface works and interacts with the user through visualized data. One would be more informed of the archival material going through this digital interface.
//Paul
//kengpul
//Section A
var x;
var y;
var circ = [];
// determines the line and size of the circle creating the circle w line inside
var drawingLine;
var lineDeg = 0;
var circleDeg = 0;
var colorStep = 0;
var colorStep2 = 0;

function setup() {
    createCanvas(480, 480);
    background(random(50,70),100,random(150,256));
}


function draw() {
    //creating perilin colors
    //cghanges size of the elements based on mouse y
    drawingLine = map(mouseY,0,height,20,height/5)
    //background(240,170,20);
    push();
    translate(width/2,height/2);
    rotate(radians(circleDeg));
    bigCirc();
    pop();
    circleDeg += map(5,0,width/2,0,drawingLine)*1.5;


    colorStep = colorStep += 0.01;
    colorStep2 = colorStep2 += 0.005;

}


//two functions under creates a line that spins
//according to the center of the circle created in bigCirc(), this is done to replicate
//the effect of an Astroid but with an interactive twist

function insideLine(){
    push();
    stroke(100,255,100);
    strokeWeight(1);
    //moves origin to center and top so the lines can rotate as it should
    translate(width/2-drawingLine,drawingLine/2+drawingLine*2);
    rotate(radians(lineDeg));
    line(0,0,0,drawingLine/2);
    strokeWeight(7);
    var pointCol = 255 * noise(colorStep2);
    stroke(pointCol,10,10);
    point(0,drawingLine*2);
    pop();
    //changes how "circular" the dots are printed
    lineDeg += map(mouseX,0,width,0,5);
}

function bigCirc(){
    noFill();
    strokeWeight(1.5);

    //rgb value created with noise so each color doesnt vary too much circle to circle
    var r = 255 * noise(colorStep+5);
    var g = 255 * noise(colorStep+15);
    var b = 255 * noise(colorStep+20);
    stroke(r,g,b);
    circle(width/2-drawingLine,drawingLine/2+drawingLine*2,100);
    insideLine();
    //rotates the insideLine inside the circ
}
//when clicked , canvas resets with diff background so the program doesnt over crowd
function mousePressed(){
   background(random(50,70),100,random(150,256));
}
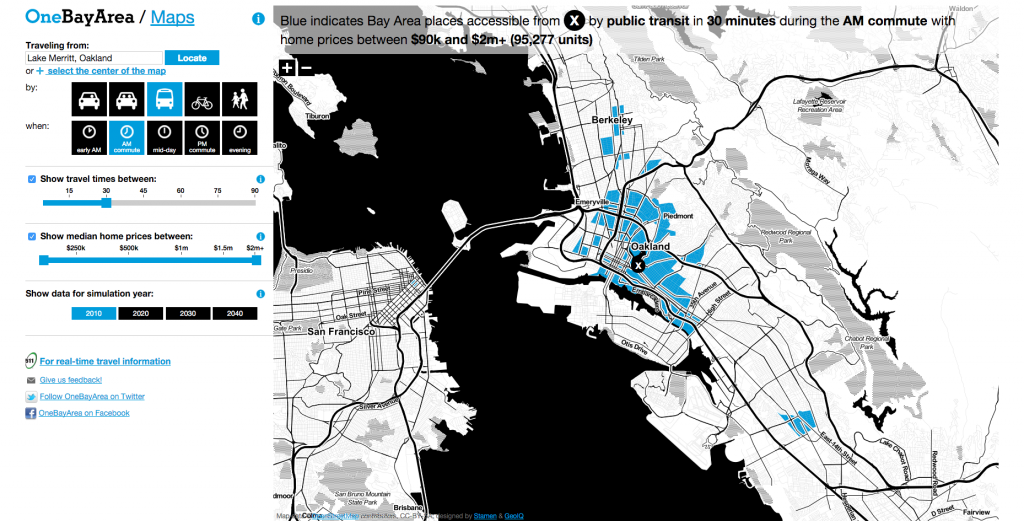
For this week’s blog about information visualization, I found the work by the Stamen Studio very compelling, especially the “OneBayArea Map” that mapps transit ranges around the entire bay area in one program. Besides the eye-catching and interactive homepage, their works include very strategic methods of making useful maps that get straight to the point without sacrificing information. The “OneBayArea Map” not only lets commuters understand commute time and distance, it directly relates this information with housing prices, helpful for homebuyers to find ideal homes to commute from. Moreover, it also encourages commuting methods like bussing, biking, and walking by showing how little time they actually take in some cases, comparable to single person vehicles. It also suggests concepts relating to socioeconomic status and access to public transportation systems. To do so, I think this project includes layering many different types of maps and consolidating the data of these, which is then transferred into codes to revisualize these data into an interactive map. The map’s aesthetics not only generates a nice looking program, but it also creates simplicity and clarity that is very important to an info-packed map.
![[OLD SEMESTER] 15-104 • Introduction to Computing for Creative Practice](../../../../wp-content/uploads/2023/09/stop-banner.png)