Looking Outwards-08

Graham Murtha

Section A

The designer I looked into this week was Lindsay Grace, an American artist who’s body of work focuses on exploring how games and interactive media shape the culture, education, and ethics of different communities. He was an esteemed professor at American University, and ran the “Gamelab” JOLT Studio there as well. He is from Miami, Florida, and, despite his many years in New York City, recently moved back to Miami to teach at University of Miami. He is also an award winning author. What I find fascinating about his body of work is how unique it is in the world of design academia, as I feel that “gaming” and “play” are bad words in that sphere. I’ve always had an issue with that fact, as games are one of the best ways to teach both children and adults alike. I have seen that, oftentimes, people my age remember more about the videogames they played in middle school, rather than the classes they took. Kids are automatically expecting to have fun while playing a game, and so if we integrate games with education, kids will automatically be more engaged in the topics. Professor Grace illustrates this through his discussion of gaming competition, and how it works as a catalyst for academic prowess and innovation.

Professor Lindsay Grace’s Website

Looking Outwards-08

The individual I selected is Catherine D’Ignazio. D’Ignazio is an associate professor of Urban Science and Planning at MIT. She is also the Director of the Data + Feminism Lab, also at MIT. Her work focuses on using data and computational methods to work towards gender and racial equality through the lense of urban design and architecture. She also authored the book Data Feminism that she published through MIT Press. A project of D’Ignazio’s that I was particularly interested in was her creation of the reproductive justice hackathon. The hackathon pushed individuals to come up with solutions to the issues that arise with finding a secure place to pump breast milk as well as finding better solutions to current pumping devices. Currently, a big focus of her work is discovering and elevating “hidden data.” This includes data such as how many women have died during childbirth in countries where that data is rarely recorded. D’Ignazio’s presentation style is very engaging and personable. She started her presentation with her own experience pumping in the MIT Media Lab as way to engage with her work and its importance.

Looking Outwards / Brian House

Brian House is an accomplished artist working with ‘human and nonhuman systems’ to create works that translate data into visual and audible experiences. He studied at multiple universities, earning degrees in Computer Science and Computer Music/Multimedia [Columbia (bachelors), Chalmers tekniska högskola (masters), and Brown (PhD)], and is currently an art professor at Lewis and Clark College in Portland.

House’s methods of data collection, as well as his productions, are multidisciplinary, focusing not only on the existing rhythms and natural trends of environmental dynamics but on the human impacts on these trends. His work spans past, present, and future, visual art, music, and technology. Much of his work– if not, all– is focused on emphasizing the importance of environmental awareness. Despite being grounded in science and data collection, these works are historically, culturally, and politically aware. When speaking about his work, House tends to provide such context prior to explanations of a given project’s approach, method, objective, and result. His speech for Eyeo 2018 opened with an acknowledgment of the Indigenous land upon which the venue was built. I admire the conscientiousness in both his work and his presentations, as well as the common thread of translating the world around us into something we can hear. House’s projects are extremely powerful, moving, and at the same time, more educational than I had expected.

Animas, 2017

My favorite project of his is Animas (2017). The objective of this work was to convert the real-time fluctuations of the Animas river’s heavy metal content into audible vibrational tones. Collecting data through water sensors installed in the river, House suspended sheets of the four heavy metals which had surpassed safe levels in the Animas. Each sheet was rigged with a sensor and amplifier which projected the individual frequencies of the metals in correspondence with their level fluctuations in the Animas.

A brief sound clip of Animas.
Water sensor installed in the Animas River to collect real-time data.

The Creative Practice of an Individual: Amanda Cox

Alexia Forsyth
15-104
October 25, 2022

Amanda Cox presented for the Eyeo Festival in 2018 where she discussed processes, practices, and lessons she has learned through her career. She is the editor of a feature of The New York Times called The Upshot. It launched in 2014 and is aimed to provide news and commentary via graphics and charts. Amanda graduated from St.Olaf in 2001 with a bachelor’s degree in math and economics and graduated from the University of Washington in 2005 with a master’s degree in statistics. She won the National Design Award in 2009 and the Excellence in Statistical Reporting Award in 2012. I really admire Amanda’s work because it is useful and practical. Through her data visualization, she has been able to make a difference in media politics and information distribution. She worked on a project that measured the percentage of children who grew up rich and how their wealth changed as an adult. She looked into differences in race and incarceration rate. In the 2016 election, her team worked on a project called ‘Chance of Winning Presidency’ that repetitively forecasted the likelihood of Clinton and Trump’s success. Although the code behind each of her projects is complicated the outer visual is simple and user-friendly. She explained the impact and importance of her work more than the code behind it, avoiding using intimidating jargon.

Bhaboo’s Looking Outwards – Week 7

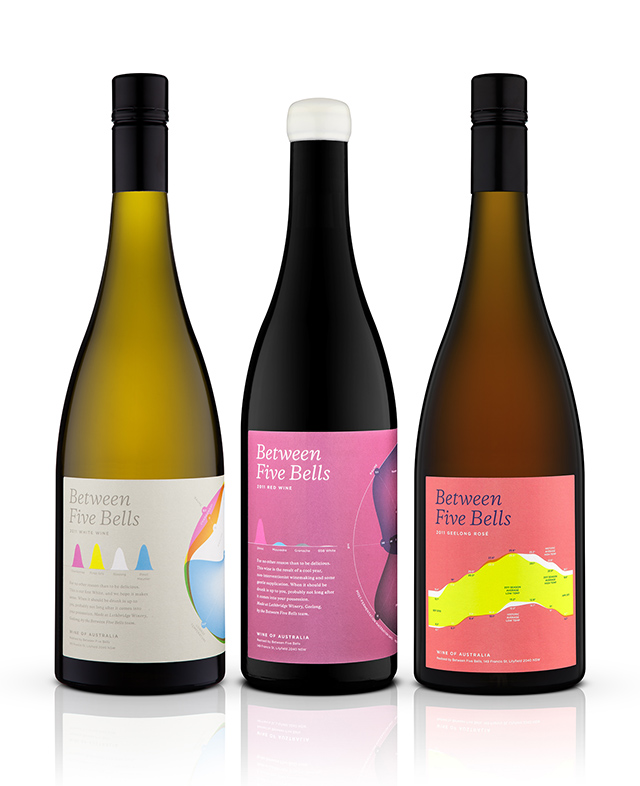
This week’s delve into the artist Nicholas Feltron was particularly intriguing. No only has he created his own art and visuals, but has also created unique lessons on platforms such as Skillshare. The project of his I found the most interesting was the labeling he did on the wine bottles sold in Australia. I found it incredible how unique and detailed the labels were despite their minimalist and simplistic design, echoing the artist’s eye for concise messaging and aesthetic work. It is clear that Feltron used a multimedia-based approach to create his work, combining the likes of photography and digital design to produce his pieces.

Project 7 Curves

This is my project: the left and right mouse movements change the number of curves and the up and down spins the objects. Clicking the mouse changes the type of circle on the outside of the rose curve.

sketch
//Michael Li
//Section C 

//set variables for points
var points = 100;
//set variable for state machine
var type = 0


function setup() {
    createCanvas(400, 400);
    frameRate(25)
}


function draw() {
    background(50);
    //add text
    text("Click to change shape", 20, 30)
    //move to the center of the canvas
    translate(width/2,  height/2)
    
    //to change the shapes between spiral and flower
    if (type == 0){
    spiral() //spiral function
    } else if(type == 1){
        //repeat the function for flower
        for(var i = 0; i <5; i++){
            //different state
            drawEpitrochoid(i) 
        }
    } 
    //draw center flower
    drawRoseCurve();


}

function drawRoseCurve() {
    // RoseCurve
    //constrain the mouse within the canvas
    var conMX = (constrain(mouseX, 0, width))
    var conMY = (constrain(mouseY, 0, width))
    //map the height of the rosecurve
    var h = map(conMY, 0, width, width*1/5, width*2/5)

    var x;
    var y;
    //map the color to the mouse movement
    var mapColorX = map(mouseX, 0, width, 100, 255)
    var mapColorY = map(mouseY, 0, width, 100, 255)
    //the color of the rosecurve changes depending on the outer elements
    if(type == 0){
        //blue and orange
        var c = color(mapColorX, mapColorX/2+mapColorY/2, mapColorY)
    } else if (type == 1){
        //green and purple
        var c = color(mapColorX/2+mapColorY/2, mapColorY, mapColorX)
    }
    var r; 
    //have the variable n only store odd numbers for better rose curve
    var n = printOdd(int(map(conMX, 0, width, 3, 20)))
    
    noFill()
    strokeWeight(1)
    stroke(255)
    circle(0, 0, h*2)
    fill(c)
    stroke(c);
    //draw rose curve
    beginShape();
        for (var i = 0; i < points; i++) {
            var theta = map(i, 0, points, 0, PI);
        
            r = h*cos(theta*n)
            x = r*cos(theta+conMY)
            y = r*sin(theta+conMY)
            curveVertex(x, y);

        }
    endShape(CLOSE)
}

//draw spiral
function spiral(){
    //constrain mouse within the canvas
    var conMY = (constrain(mouseY, 0, width))
    //map value to mouseY
    var a = map(conMY, 0, width, width*1/5, width*2/5)
    
    var x;
    var y;
    var r;

    noFill()
    push()
    beginShape()
    //map number of points to mouse Y
    //spiral grows as mouseY moves
    var mapYPoints = map(mouseY, 0, height, 25, 100)
        //draw spiral
        for (var u = 0; u < mapYPoints; u++) {
            //theta depend on mouse Y
            //spiral spins
            var theta = map(u, 0, mapYPoints/10, 0, TWO_PI);
            //circle size depend on mouseY
            var mapSize = map(u, 0, mapYPoints, 40, 10)
            r = ((theta)**(1/2))*a/4
            x = r*cos(theta+10)
            y = r*sin(theta+10)

            curveVertex(x, y)
            stroke(255-u*4)
            fill(255-u*4)
            //draw circles on the spiral
            circle (x, y, mapSize/2)
            stroke(200)
            noFill()
        }
    endShape()
}
//draww epitrochoid
function drawEpitrochoid(rot){
    push()
    //constrain mouseX and mouseY
    var conMX = (constrain(mouseX, 0, width))
    var conMY = (constrain(mouseY, 0, width))
    var a = map(conMY, 0, width, width*1/5, width*2/5)
    var b = constrain(a / int(conMX / 30), 0, 20)
print(a)
    var x;
    var y;

    //rotates the shape each loop
    rotate(rot+conMY/10)
    noFill()
    stroke(200)
    push()
    beginShape()
    //fill the shape with lower opacity to create layering effect
    fill(200, 200, 200, 50)
    var mapYPoints = map(mouseY, 0, height, 0, 25)
    //draw epitrochoid
        for (var u = 0; u < 100; u++) {
            var theta = map(u, 0, 100, 0, TWO_PI);

            x = rot/2*(a+b)*cos(theta)-b*cos(((a+b)/b)*theta);
            y = rot/2*(a+b)*sin(theta)-b*sin(((a+b)/b)*theta);
            curveVertex(x, y)

            
        }
    endShape(CLOSE)
    pop()
}
//only store odd numbers in a variable
function printOdd(x){

    if(x%2 == 0){
        return x-1
    } else{
        return x
    }
}
//swtich the type when mouse pressed

function mousePressed() {
    type += 1
    if(type > 1){
        type = 0
    }
}

Project 7: Curves

Abstract roses using astroids and astroid evolutes. Astroids rotate using mouseX and scale using the minimum of mouseX and mouse Y. Random astroids are added to the canvas. The color of these depends on the mouse’s position on the canvas. If left on canvas they are red, and if on right of canvas they are black. Moving mouse along diagonals creates and in bottom right corner creates best shapes.

sketch – Copy – Copy – Copy
// Ana Furtado 
// Section E
// Project 7 Composition with Curves

var nPoints = 100;

function setup() {
    createCanvas(480, 480);
    background(255);
    frameRate(10);
}

function draw() {
    
    strokeWeight(3);

    //rotates and scales by mouse at top right
    //brown/red at left and bottom
    push();
    translate(width/4, height/4);
    scale(mouseX/width);
    rotate(radians(min(mouseX,mouseY)));
    drawAstroid();
    if (mouseX < width/2) {
        stroke('brown'); 
        rotate(radians(min(mouseX,mouseY)));
        drawAstroid();
    } 
    pop();

    //rotates and scales by mouse at bottom left
    //brown/red at left and bottom
    push();
    //translate(width/2, height/2)
    translate(width/4 * 3, height/4 * 3);
    scale(mouseX/width);
    rotate(radians(min(mouseX,mouseY)));
    drawAstroid();
    if (mouseX < width/2) {
        stroke('brown'); 
        rotate(radians(min(mouseX,mouseY)));
        drawAstroid();
    } if (mouseY > height/2) {
        stroke('brown'); 
        rotate(radians(min(mouseX,mouseY)));
        drawAstroid();
    }
    pop();

    //rotates and scales by mouse at random location 
    //move/leve mouse to left of canvas for red atroids 
    //move/leave mouse to right of canvas for black atroids 
    //move/leave in top right of canvas to fill with more black atroids
    push();
    translate(random(0,480), random(0,480));
    scale(0.5);
    rotate(radians(min(mouseX,mouseY)));
    drawAstroid();
    if ( mouseX < width/2) {
        stroke('brown'); 
        rotate(radians(min(mouseX,mouseY)));
        drawAstroid();
    }
    pop();


    //originals that stay in  splace
    //only show in beginning
    //scaled and rotated turns the astroid into an atroid evolute
    push();
    translate(width/2, height/2);
    drawAstroid();
    pop();

    //stays in place scale 0.5
    push();
    translate(width/2, height/2);
    scale(0.5);
    rotate(radians(45));
    drawAstroid();
    pop();

    //stays in place scale 0.25
    push();
    translate(width/2, height/2);
    scale(0.25);
    rotate(radians(45));
    drawAstroid();
    pop();

}

function drawAstroid() {
    //Astroid
    //https://mathworld.wolfram.com/AstroidEvolute.html

    var x;
    var y;
    var a = 300;

    //fill('pink');
    noFill();
    beginShape();
    for (var i = 0; i < nPoints; i++) {
        var t = map(i, 0, nPoints, 0, TWO_PI);
        //angleMode(DEGREES);
        x = a * (cos(t) * cos(t) * cos(t));
        y = a * (sin(t) * sin(t) * sin(t));
        vertex(x, y);
    }
    endShape(CLOSE);
    constrain(a, 0, 325);
}

I think the most difficult part of this was getting the shape to be represented properly.

Looking Outwards – 07

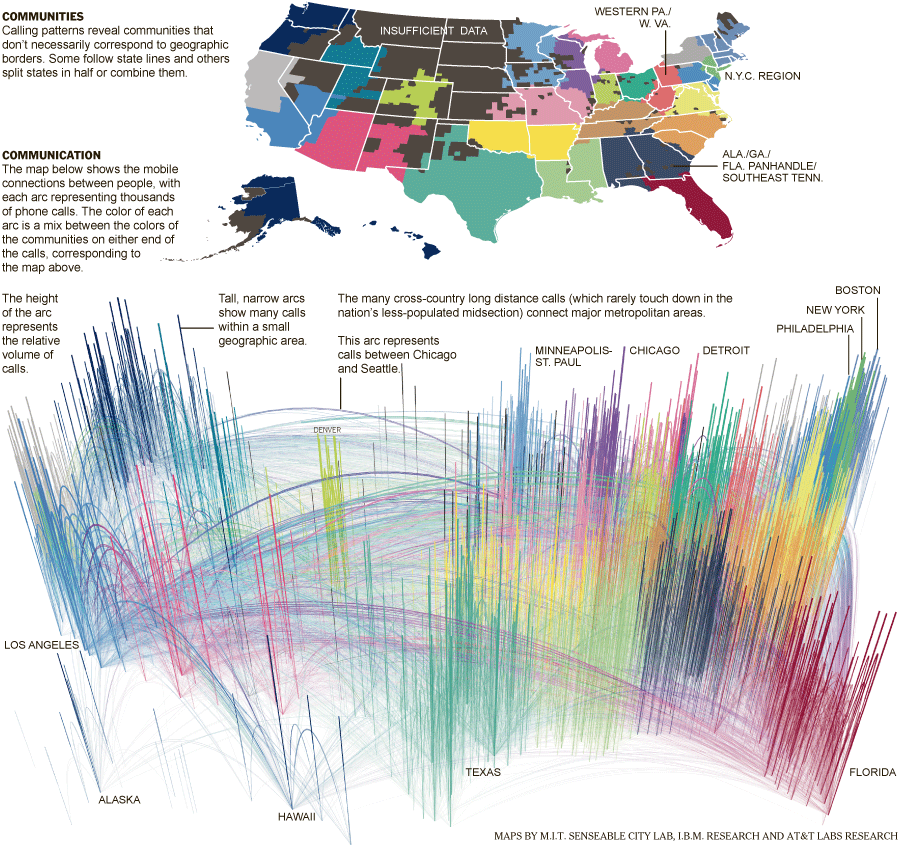
I admire the phone-Call Cartography project by the New York Times in 2011. The aggregate cell phone traffic data from the United States in July of 2010 was analyzed by researchers from M.I.T., AT&T and I.B.M. It shows how cities have become hubs and connect to other parts of the country. These communities shown by different colors on the map have little to do with geographic boundaries. I admire it because it shows patterns of how people are brought together over long or short distances. I think the creators’ artistic sensibilities are shown in the way this enormous amount of data is visualized. For example, the colors used, the areas drawn together, and the focus of the maps. Although, I think it could have been clearer in the second map which lines are connecting different places. Many of the lines are lost because they are too thin, or the colors blend together. Also, it is different to tell where they end because of the angle of the map and because there is no real map underneath, the reader is left with minimal text and shapes as reference. 

https://archive.nytimes.com/www.nytimes.com/imagepages/2011/07/03/opinion/sunday/03phoneimg.html?ref=sunday-review

Phone-call Cartography Map of the US from July of 2010. Many cities are connected together by arcs of different colors and heights, representing different areas and amounts.

Project-07: Composition with Curves

sketchDownload
//Alicia Kim
//yoonbink@andrew.cmu.edu
//Section B

var nPoints = 100;
var r;

function setup() {
    createCanvas(480, 480);
    background(220);
    
    r=0;

    
}

function draw() {

// gradient background (adapted from my project 6)
    for(var j=0; j<height; j+=1) {
        stroke(lerpColor(color(127,255,212) ,color(255,253,208),j/height));
        line(0,j,width,j);
    }

    noStroke();

    push();
    translate (width/2, height/2); 

    noFill();
    if (r<=15){
        r+=0.17;
    }
    else{r=0}
    drawHeart2(r);
    drawDevil();
    pop();

    drawHeart1();
}

function drawDevil() {
    // https://mathworld.wolfram.com/DevilsCurve.html
    // adapted from drawCranoid example from Wk 7 Deliverable example

    
    var x;
    var y;


    fill(250,250,210);
    beginShape();
    for (var i = 0; i < nPoints; i++) {
        
      
        var a = constrain((mouseX / width), -16.0, 16.0);
        var b = constrain((mouseY / height), -16.0, 16.0);
        var t = map(i, 0, nPoints, 0, TWO_PI);
    

        x = 100*cos(t)*sqrt((sq(a)*sq(sin(t))-(sq(b)*sq(cos(t)))/(sq(sin(t))-sq(cos(t)))));
        y = 100*sin(t)*sqrt((sq(a)*sq(sin(t))-(sq(b)*sq(cos(t)))/(sq(sin(t))-sq(cos(t)))));
        vertex(x, y);
    }
    endShape();
}

//cursor  heart
function drawHeart1(){

    var x2;
    var y2;

    fill(250);
    beginShape();
    for (var j = 0; j < nPoints; j++) {
     
        var t2 = map(j, 0, nPoints, 0, TWO_PI);
        

        x2 = mouseX+2*16*pow(sin(t2),3);
        y2 = 2*(13*cos(t2)-5*cos(2*t2)-2*cos(3*t2)-cos(4*t2));
        y2= mouseY-y2 
        vertex(x2, y2);
    }
    endShape();
}

//background heart
function drawHeart2(r){

    var x3;
    var y3;
    // var r;
    fill(173,216,230);
    beginShape();
    // r=10;
    // r+=1;
    
    for (var j = 0; j < nPoints; j++) {
        
        var t2 = map(j, 0, nPoints, 0, TWO_PI);
        

        x3 = r*16*pow(sin(t2),3);
        y3 = -r*(13*cos(t2)-5*cos(2*t2)-2*cos(3*t2)-cos(4*t2));
      
        vertex(x3, y3);
    }
    endShape();
}

Looking Outwards 07: Information Visualization

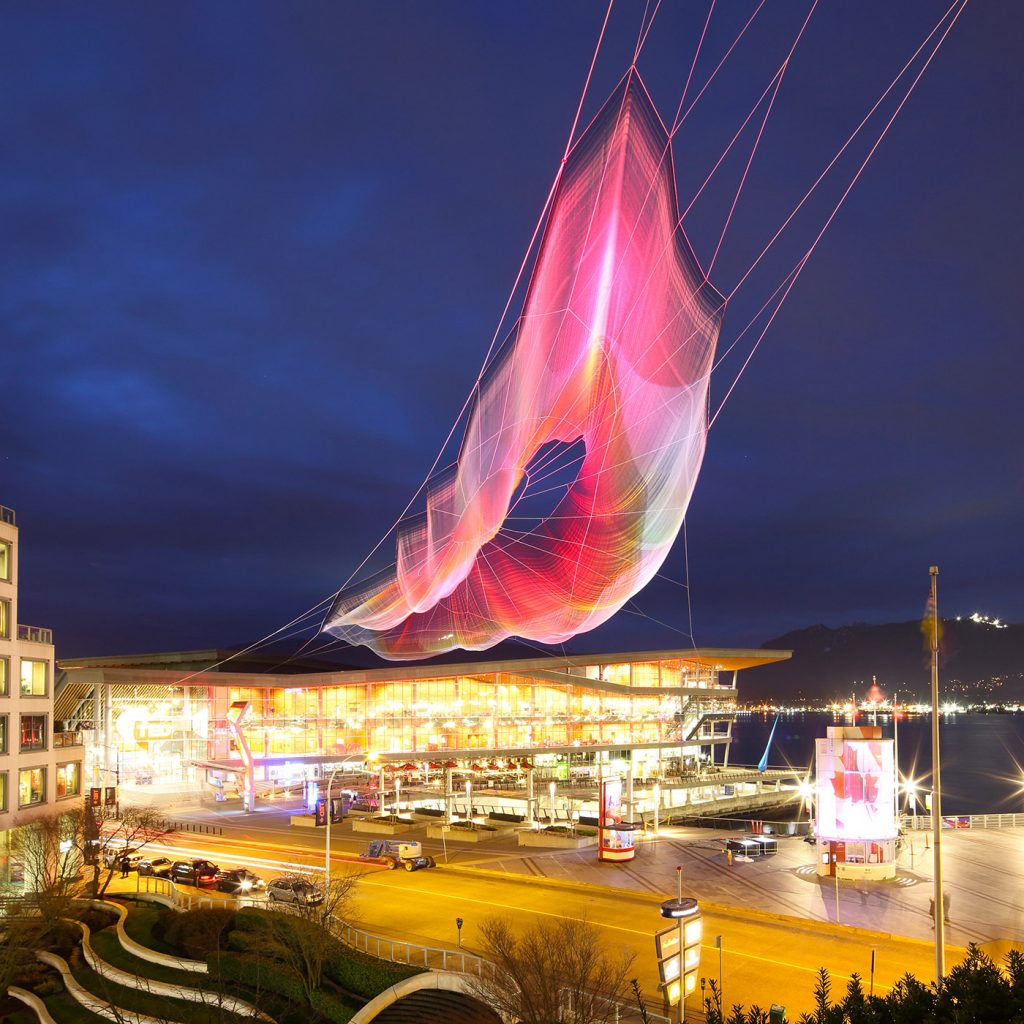
I am inspired by the project, Unnumbered Sparks by Aaron Koblin. This interactive sculpture installation is a combination of art and technology based on custom software. 

Basically, the sculpture is made up of a complex matrix of hand and machine-made knots and braided fiber, and it’s spanned between the city’s existing architectures. To create a geometric and structural design for the rope network, the artist utilized a custom software, implementing an “adaptive form finding” algorithm. He also used the custom 3D software by Autodesk to model the sculpture and test its feasibility by exploring density, shape, and scale in greater detail. What makes this giant aerial netted sculpture special and admirable is the dynamic interaction between visitors and the artwork; The work visualizes visitors’ physical gestures on mobile devices in real-time through multi-colored light projection on the sculpture. The creator’s artistic sensibilities are manifested in his pattern design of the structural ropes and the aesthetic installation of it that well blends into the city environment.

http://www.aaronkoblin.com/project/unnumbered-sparks/

Unnumbered Sparks