LookingOutwards-04 Sound Arts

Light & Sound Synthesis: In Conversation with Amay Kataria by Amay Kataria

The project Supersynthesis use creates an interaction between light and sounds. I admire how the project changes the patterns of the lights depending on the patterns of the sounds. I admired the changing light patterns, because it satisfied my imagination of how programming influences reality by creating lights that simultaneously change in pattern with sound waves. In this sense, these lights just visualized sound waves.

It’s complicated for me to understand how the programs behind this work, but I can summarize it in an abstract manner. The artwork was divided into 24 light sources that have 24 pitches, which will be triggered when different pitches are detected. The program Amay created can allow machines to detect each pitch and control the light sources.

The Amay Kataria’s artistic sensibilities manifest in the final form through visualization of the invisible sounds waves with lights. It was visually pleasant to watch these light changes in wave patterns in the dark according to the sound of the drums.

Link: Light & Sound Synthesis: In Conversation with Amay Kataria – CreativeApplications.Net

Video:

Looking Outwards – 04

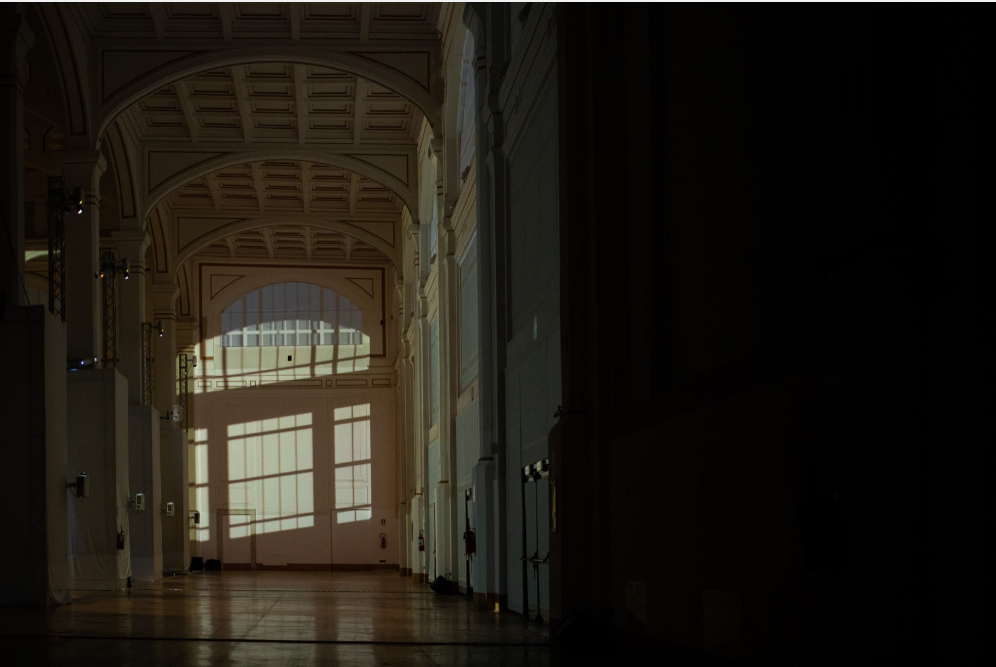
Sole is an artificial sun by Quiet Ensemble. The purpose of this project is to create a 360 degree video – mapping to simulate the movement of the sun around the inside of a space. Their project used the space of the Salone degli Incanti in Trieste.

Using artificial shadows and lights, the user is able to experience an unreal simulation of a space at any real or unreal context showing imaginary as well as possible paths, “broadening our horizons”. I like the combination between light and technology in order to make a replication of possibilities or non-possibilities.

LINK HERE

Project 4 – String Art

When you reload it changes the color of the bottom left quadrant.

sketch
var dx1;
var dy1;
var dx2;
var dy2;
var numLines = 30;

function setup() {
    createCanvas(400, 300);
    background(50);
    strokeWeight(0.01);
    stroke(255);
    line(50, 150, 200, 250);
    line(50, 150, 200, 50);
    line(200, 50, 350, 150);
    line(350, 150, 200, 250);
    line(50, 150, 350, 150);
    line(200, 50, 200, 250);

    //line(50, 50, 150, 300);
    //line(300, 300, 350, 100);
    dx1 = (200-50)/(1.05*numLines); // top left line X
    dy1 = (150-50)/(1.05*numLines); // "" Y
    dx2 = (350-200)/(1.05*numLines); // top right line X
    dy2 = (150-50)/(1.05*numLines); // "" Y
    dx3 = (350-200)/(1.05*numLines); //bottom right line X
    dy3 = (250-150)/(1.05*numLines); // "" Y
    dx4 = (200-50)/(1.05*numLines); //bottom left line X
    dy4 = (250-150)/(1.05*numLines); // "" Y


}

function draw() {

    strokeWeight(0.3); 
    stroke(0, 255, 0); //Quadrant 1 Y Changing (Green)
    var x1 = 50;
    var y1 = 150;
    var x2 = 200;
    var y2 = 50;

    for (var i = 0; i <= numLines; i += 1) {
        line(x1, y1, x2, y2);
        y2 += dy2;
    }

    stroke(255, 0, 0);//Quadrant 2 Y Changing (Red)
    var x3 = 350; 
    var y3 = 150;
    var x2 = 200;
    var y2 = 50;
    
    for (var i = 0; i <= numLines; i += 1) {
        line(x3, y3, x2, y2);
        y2 += dy2;
    }

    stroke(255, 0, 0); //Quadrant 3 Y Changing (Red)
    var x3 = 350; 
    var y3 = 150;
    var x4 = 200;
    var y4 = 250;

    for (var i = 0; i <= numLines; i += 1) {
        line(x3, y3, x4, y4);
        y4 -= dy4;
    }

    stroke(random(255), random(255), random(255)); //Quadrant 4 Y Changing (Random);
    var x1 = 50; 
    var y1 = 150;
    var x4 = 200;
    var y4 = 250;
   
    for (var i = 0; i <= numLines; i += 1) {
        line(x1, y1, x4, y4);
        y4 -= dy4;
    }

    stroke(77, 77, 255); //Quadrant 1 X Changing (Blue)
    var x2 = 200; 
    var y2 = 50;
    var x1 = 50;
    var y1 = 150;

    for (var i = 0; i <= numLines; i += 1) {
        line(x2, y2, x1, y1);
        x1 += dx1;
    }

    stroke(80, 200, 120);
    var x2 = 200; //Quadrant 2 X Changing (Green)
    var y2 = 50;
    var x3 = 350;
    var y3 = 150;

    for (var i = 0; i <= numLines; i += 1) {
        line(x2, y2, x3, y3);
        x3 -= dx3;
    }

    stroke(0, 0, 255); //Quadrant 3 X Changing (Blue)
    var x4 = 200; 
    var y4 = 250;
    var x3 = 350;
    var y3 = 150;

    for (var i = 0; i <= numLines; i += 1) {
        line(x4, y4, x3, y3);
        x3 -= dx3;
    }

    stroke(random(255), random(255), random(255)); //Quadrant 4 X Changing (Random Color)
    var x4 = 200; 
    var y4 = 250;
    var x1 = 50;
    var y1 = 150;
    

    for (var i = 0; i <= numLines; i += 1) {
        line(x4, y4, x1, y1);
        x1 += dx1;
    }


    noLoop();
}

lab 212 – passifolia

video by Lab 212 demonstrating the installation in action

Passifolia is an audiovisual installation by Lab 212, exhibited in Paris in 2020. Visitors enter a dark and hazy room shaped by 16 vertical light beams. When one steps into a light beam, a camera sensor detects the change in pixels, the light beam widens, and directional speakers play a pre-composed melody of bird songs and ambient nature sounds, and the beam narrows again. I appreciate how this invites the visitor to explore the space and relish in the sounds of nature, literally spotlighted. While the sound itself is not computationally generated, the layers of signal processing are numerous (i.e. sending a Midi note to Ableton Live, to the light projector, and to the directional speakers).

visitors exploring the installations’ light beams

getting stringy

sketch
// Jaden Luscher
// jluscher
// section A
// project 4: string art

// increments along lines
var dx1;
var dy1;
var dx2;
var dy2;
var dx3;
var dy3;
var dx4;
var dy4;

// line density
var numLines = 50;

// determines location / quadrant of strings1 function
// when mycount = 0, the top left quadrant is drawn
var mycount = 0;

function setup() {
    createCanvas(400, 600);
    background(200,200,0);
}

function draw() {
  dx1 = (50-100)/numLines;
  dy1 = (150-300)/numLines; // split up L1

  dx2 = (200-200)/numLines;
  dy2 = (250-50)/numLines; // split up M1

  dx3 = (350-300)/numLines;
  dy3 = (150-300)/numLines; // split up R1

  dx4 = (350-50)/numLines; // split up horizontal line
  dy4 = (600-0)/numLines/2;  // split up long vertical (height)

  // brown lines
  push();
  strokeWeight(0.2);
  stroke("brown");
  bgStrings(350, 300, 200, 0);
  bgStrings(350, 300, 400, 0);
  bgStrings(50, 300, 200, 0);
  bgStrings(50, 300, 0, 0);
  pop();

  stroke(255);
  strokeWeight(0.7);
  outline(); // draw base lines (L1, M1, R1, L2, M2, R2)

  push();
  strings1(50, 150, 200, 250);  // call function to connect L1 to M1
  mycount = 1;
  strings1(350, 150, 200, 250);  // connect R1 to M1

  translate(width, height); // flip canvas to mirror strings
  rotate(PI);
  mycount = 0;  // reset to 0
  strings1(50, 150, 200, 250);  // L1 to M1
  mycount = 1;  // string1 uses "else" conditional do draw top right quadrant
  strings1(350, 150, 200, 250);  // R1 to M1
  pop();

  // lines at center of canvas (resemble parallelogram)
  strings2(200, 250, 50, 300);
  strings2(200, 350, 50, 300);

  noLoop();
}

function outline() {
  // top lines
  line(50, 150, 100, 300);  // L1
  line(200, 250, 200, 50);   // M1
  line(350, 150, 300, 300);   // R1

  // bottom lines
  line(50, 450, 100, 300);  // L2
  line(200, 550, 200, 350);  // M2
  line(350, 450, 300, 300);   // R2

  push();
  strokeWeight(2);
  line(width/2, 0, width/2, 250);
  line(width/2, height, width/2, 350);
  pop();

  // other lines
  line(0, height/2, width, height/2);   // horizontal line
}

function bgStrings(a, b, x, y) {
  for (var i = 0; i <= numLines*2; i += 1) {
    line(a, b, x, y);
    y += dy4;
  }
}

function strings1(x1, y1, x2, y2) {
  for (var i = 0; i <= numLines; i += 1) {
    line(x1, y1, x2, y2);
    if(mycount == 0) {  // top left quadrant
      x1 -= dx1;
      y1 -= dy1;
      x2 -= dx2;
      y2 -= dy2;
    } else {          // top right quadrant
      x1 -= dx3;
      y1 -= dy3;
      x2 -= dx2;
      y2 -= dy2;
    }
  }
}

function strings2(a, b, x, y) {
  for (var i = 0; i <= numLines; i += 1) {
    line(a, b, x, y);
    x += dx4;
  }
}

lookingoutwards-04-sectionA

Ralf Baecker’s “Floating Codes” is an immersive and abstract piece of sound and light installation art. It’s made up of many different hexagonal shapes that are constructed by flat metal sticks laid on the ground with sticks of different heights jutting upwards at the vertices of the hexagons. The jutting sticks of lights and speakers on them that flash and make noise through a process that’s a neural network using fundamentals of machine learning and artificial intelligence. “Depending on the topology of the neurons in the grid different networks constitute interlocking circles, feedback loops, memory-like elements, random pattern generators, and other significant behavioral elements.” Thus, completely different manifestations of noises and lights flash according to each other’s behavior to create a chaotic environment for each neuron/perceptron making each other react. “The open and unsupervised system has no objective, its only goal is to maintain and conserve the propagating information in the network.” I love this installation because it utilizes machine learning to create this emulation of propagation and quasi-symbiosis that almost makes it feel like each neuron is part of a greater whole–like a community or colony of organisms. It’s robotic (both the noises and lights) yet lively (in like a cricket way), riding the fine line/liminal space between artificial and natural.

Looking Outwards – 04

The art I’ll be reviewing today is Ryoji Ikeda’s “Datamatics”. This piece explores the how we can possibly perceive multi-substance data that though present in out world; humans otherwise cannot comprehend. The piece uses pure data as a source for generating both sounds and visuals that help present time and space. The graphics are intentionally minimal and give a natural feel that you are looking at or hearing data. I’m not entirely sure how any of the data is technically generated, though I know the technologies used to collect the data. For starters, audio data can be collected through a mic and registered through pitch, volumes, harmonics, etc., these mics can also use AI learning to detect reverberance, decay, echoes, space, timbre, etc. This can then create visuals or separate audio based on the data that is a pure translation of the data. This can mean it can make a few clicks of data points, signals, analog waves, harmonies, pitches, etc. I really admire this art process as it links how we perceive the world around us to the actual real data behind it, comparing the two perceptions and letting them exists together for a moment.

https://www.ryojiikeda.com/project/datamatics/

‘FORMS – String Quartet’ by Playmodes

Alexia Forsyth

Section A

‘FORMS – String Quartet’ is an automated emulation of string musicians. Not only is the music beautiful, but the visual display is stunning and captures the essence of the song. The artists use a color code that identifies the instruments on the score and randomizes them. The generator is known as “The Steaming Bot”. The graphics are then transformed into sound. “The Steaming Bot” uses compositions from John Cage, Gyorgi Ligetti, Mestrews Quadreny, and Karlheinz Stockhausen. Every part of the network ensemble plays instrumental roles such as rhythm, harmony, and texture. The artist explains, “Images become sound spectrums, making it possible to hear what you see” (Playmodes 8). Their artistic sensibility is shown through the visualization of the musical cords and their relation to the cords.

Video: https://vimeo.com/553653358?embedded=true&source=video_title&owner=7721912

Supersynthesis

Hannah Wyatt Section A

Amay Kataria’s “Supersynthesis” artwork strives for a new form of connection through the unity of light and sound. I admire the interactive element, which allows visitors to first-hand control the wave, sound, and light patterns. Participants make edits in real-time, encouraging constant evolution of the piece, juxtaposing this innate action with advanced, intricate programming. The project assigns 24 pitches to 24 light sources arranged in leds across a physical wave, and Kararia intends to connect the audience with nature/eachother in this format. Through combining the interactions of all people with the website open, Kataria labels this event “communal computing” and as a new revolutionary method of social communication. 

Project 3

this is my project:

sketch
var d = 40;
var d2 = 30;
var rotateV = 1;
var rotateR = 2;
var rotateR2 = -1;
var rotateB = 0;
var rotateL = 1; 
var r = 100;
var g = 100;
var b = 100;
 
 
function setup() {
    createCanvas(600, 450);
    text("Xinran Yu, Seciton A");
}
 
function draw() {
    background(0);
    fill(255, 255, 0)

    //background rotating green circles 
    fill(188, 225, 40, 220);
    push();
    translate(500, 350);
    rotate(radians(rotateB));     //1
    ellipse(60, 60, d2+20, d2+20);
    rotateB += 0.6;
    rotate(radians(rotateB));     //2
    ellipse(60, 60, d2+15, d2+15);
    rotateB += 0.5;
    rotate(radians(rotateB));      //3
    ellipse(60, 60, d2+10, d2+10);
    rotateB += 0.3;
    rotate(radians(rotateB));      //4
    ellipse(60, 60, d2+5, d2+5);
    rotateB += 0.2;
    rotate(radians(rotateB));      //5
    ellipse(60, 60, d2, d2);
    rotateB += 0.1; 
    pop()

    //background lines
    push();
    translate(100, 100);
    stroke(43, 255, 248, 50);
    strokeWeight(1);
    for (var rotateL = 30; rotateL<360; rotateL++) {
        rotate(radians(rotateL));
        line(0, 0, 90, 90); 
    }
    pop();


    //rotating squares
    fill(221, 4, 137, 200);
    noStroke();
    push();
    translate(mouseX, mouseY);
    rotate(radians(rotateR));
    rotateR = rotateR - 3;
    rect(-10, 0, 100, 100);

    rotate(radians(rotateR2));
    rotateR2 = rotateR2 + 2;
    rect(0, 10, 60, 60);
    pop();

    // rotating circles,changing color due to mouseX & mouseY
    fill(126, 198, 231);
    ellipse(mouseX, mouseY, 50, 50);  // center circle
    push();
    translate(mouseX, mouseY);

    if (mouseX <= width/2 & mouseY <= height/2) {
        r = 218; //yellow
        g = 177;
        b = 79;
    } else if (mouseX < width/2 & mouseY > height/2) {
        r = 205; //orange
        g = 110;
        b = 74;
    } else if (mouseX > width/2 & mouseY < height/2) {
        r = 224; //pink
        g = 128;
        b = 231;
    } else if (mouseX > width/2 & mouseY > height/2) {
        r = 135; //red
        g = 30;
        b = 12;
    }
    fill(r, g, b);
    rotate(radians(rotateV));
    rotateV = rotateV + 2;

    //change circle's raduis
    //distance to canvas center increases, rotating radius & d increases
    var x1 = dist(mouseX, mouseY, width/2, height/2);
    d = dist(mouseX, mouseY, width/2, height/2)/3;
    d = constrain(d, 10, 100);
    ellipse(x1, x1, d, d);
    ellipse(-x1, -x1, d, d);
    ellipse(-x1, x1, d, d);
    ellipse(x1, -x1, d, d);
    ellipse(0, x1*1.5, d, d);
    ellipse(0, -x1*1.5, d, d); 
    ellipse(x1*1.5, 0, d, d);
    ellipse(-x1*1.5, 0, d, d);
    pop();   

}