![[OLD FALL 2018] 15-104 • Introduction to Computing for Creative Practice](https://courses.ideate.cmu.edu/15-104/f2018/wp-content/uploads/2020/08/stop-banner.png)
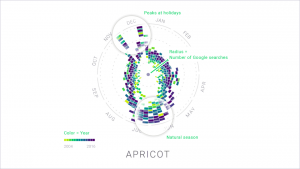
This project, The Rhythm of Food, is a visualization of google searches of food. The circle, going 360 degrees, maps to each month of the year, the color of the block represents a specific year, and the radius of the block is the number of google searches. So the farther the block is, the larger the number of google searches of that particular food in that month of the specified year. This leads to patterns that are easy to spot – for example, summer fruits are more often searched in, you guessed it, the summer.
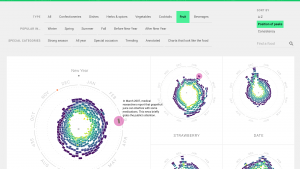
This project is clean, beautiful, and informative. It also captures big patterns and small idiosyncrasies. “Sour Cherry” is not only a fruit, but also a song by The Kills that was popular in February of 2008. This small detail is captured by this visualization, illustrating how the project does an amazing job of capturing both the large and the small, and does so in a way that is easy to understand.