![[OLD FALL 2018] 15-104 • Introduction to Computing for Creative Practice](../../../../wp-content/uploads/2020/08/stop-banner.png)
// Yoo Jin Shin
// Section D
// yoojins@andrew.cmu.edu
// Project-07-Curves
function setup() {
createCanvas(480, 480);
}
function draw() {
background(255);
// Stroke color and weight based on mouseX
var R = map(mouseX, 0, width, 170, 250);
var W = map(mouseX, 0, width, 0.3, 1.5);
push();
translate(mouseX, mouseY);
// Gray shadow curve properties
stroke(240);
strokeWeight(4);
drawCurve2();
// Colored curve properties
stroke(R, 200, 200);
strokeWeight(W);
drawCurve1();
pop();
}
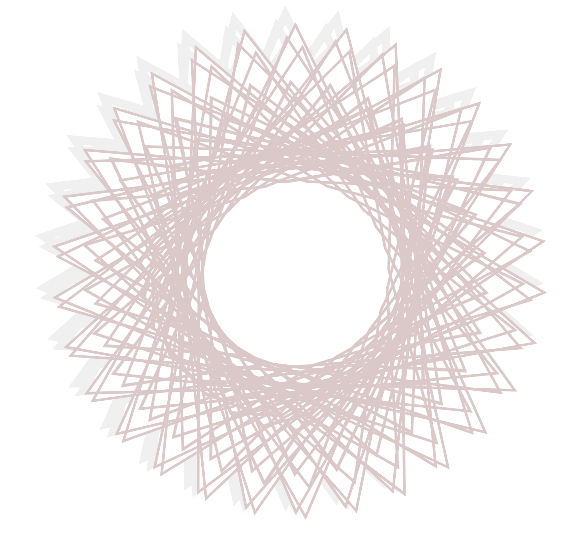
// Hypocycloid Pedal Curve (HPC)
function drawCurve1() {
var x;
var y;
var t = PI;
var a = map(mouseX, 0, width, 0, 200);
var n = map(mouseY, 0, height, 0, 10);
beginShape();
for(var i = 0; i < width; i++) {
// HPC equations from Wolfram
x = a * ((n - 1) * cos(t) + cos((n - 1) * t)) / n
y = a * ((n - 1) * sin(t) - sin((n - 1) * t)) / n
vertex(x, y);
t += 1.3;
}
endShape();
}
// HPC Gray Shadow
function drawCurve2() {
var x;
var y;
var t = PI;
var a = map(mouseX, 0, width, 0, 200);
var n = map(mouseY, 0, height, 0, 10);
beginShape();
for(var i = 0; i < width; i++) {
// Same as Curve1, but shifted slightly left/down
x = a * ((n - 1) * cos(t) + cos((n - 1) * t)) / n - 5;
y = a * ((n - 1) * sin(t) - sin((n - 1) * t)) / n - 5;
vertex(x, y);
t += 1.3;
}
endShape();
}I looked through several different curves on the Wolfram website and ended up choosing the Hypocycloid Pedal Curve. I really liked the range of patterns that it produced when I mapped its properties to the mouse position. I decided to also gradually alter the color and stroke weight (based on the position) for more variety. I tried creating more depth by adding a slightly shifted and faded duplicate of the colored curve, similar to a shadow. Few of the different curves are shown below: