Yingying Yan — Project 07 – Curves

sketch

/*
Yingying Yan
Section E
yingyiny@andrew.cmu.edu
Project-07-curve
*/

var k = 1; // controls the numbers for the flower
function setup() {
    createCanvas(480, 480);
    angleMode (DEGREES)
    frameRate(15);

}

function draw() {
    background(220);
    translate(240,240);
    stroke(0);
    strokeWeight(2);
    noFill();
    // call the flower function and draw the curve
    flower();
}

function flower() {
    // x = cos(k data) cos(data)
    // y = cos(k data) sin(data)

    //identify all the variables from the equation
    var x;
    var y;
    var theta = 45;

    //map and constrain to make mouseX and mouseY control the size and 
    //number of panels of the flower
    var boundX = constrain(mouseX, 0, 480);
    var boundY = constrain(mouseY, 0, 480);
    var k = map(boundX, 0, 480, 0, 20);
    var theta = map(boundY, 0, 480, 45, 360);
    var sizz = map(boundX, 0, 480, 100, 250);
    //i has to start at 500 otherwise the size of the flower will be too small
    //then plug all variables into the equation from wekipedia
    beginShape()
    for (var i = 500; i < 1000; i++) {
        x = cos(k * theta) * cos(theta)
        y = cos(k * theta) * sin(theta)
        vertex(x * sizz, y * sizz);
        theta += 1; //keep theta changes to make more interesting shape
    }
    endShape();

}

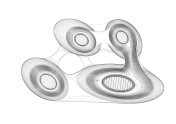
I used the rose formula from Wikipedia. I think this project is very fun because it is not super hard but simple code creates a crazy result. This project also allowed me to understand “constraint” and “map” better. I never thought that they can be used together, and they are so cool! I do not have enough time to render my drawing, but it turned out fine after all. I enjoy this project a lot.

Yingying Yan-LookingOutwards-7

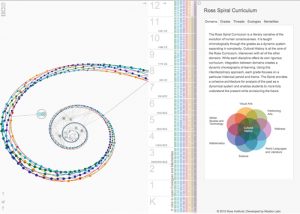
Ross Spiral Curriculum by Santiago Ortiz represents the evolution of human consciousness through the integration between domains, mainly cultural history, to create a dynamic choreography of learning. The goal is to allow students to understand the past as a dynamical system, better understand the present and envisioning the future.

The left is an example of the spiral showing how data connects together. The picture on the right shows the domains of the system.

Visually it is a colorful spiral that has different points on it. But when you zoomed in, there are connections between the data. Then you can compare each grade’s data by clicking the menu on the right. I think it is a very interesting way to display data. Visually it is very attractive can be an art piece that someone can hang on their wall, just like an abstract piece of modern art. One criticism will be: the project is a bit hard to understand, and there is not a lot of correlation between the data and the visual representation.

Ross Spiral Curriculum: An Interdisciplinary Approach to Science (La Main à la Pâte 2015 Presentation) from Ross Institute on Vimeo.

Yingying Yan – Project 06 – Abstract Clock

sketch

/*
Yingying Yan
Section E
yingyiny@andrew.cmu.edu
Project-06
*/

function setup() {
    createCanvas(480, 480);
    angleMode(DEGREES);
}

function draw() {

    background(13, 18, 54)

	translate(240,240)
    //change hour, min and sec into variables
	var hr = hour();
    var min = minute();
    var sec = second();

    //rotate the entire canvas so people can read it as a clock

    rotate(-90);
    noFill();

    //remap hour into 360 degree angles and draw an
    //arc that keeps track of the hours
    var mappedHr = map(hr % 12, 0, 12, 0, 360);
    push();
    stroke(5, 167, 221);
    strokeWeight (20);
    arc(0,0,300,300, 0, mappedHr);
    pop();
    //remap min into 360 degree angles and draw an
    //arc that keeps track of the minutes
    var mappedMin = map(min, 0, 59, 0, 360);
    push();
    stroke(223, 230, 244);
    strokeWeight(10);
    arc(0,0,200,200, 0, mappedMin);
    pop();

    //remap second into 360 degree angles
    var mappedSec = map(sec, 0, 59, 0, 360);

    //re rotate the circlces or planets
    push()
    rotate(-45)

    //planet one which follows the hour
    push()
    rotate(mappedHr);
    noStroke()
    fill(42, 51, 127, 100);
    ellipse(100, 100, 50, 50);
    pop();

    //planet two which follows the minutes
    push()
    rotate(mappedMin);
    noStroke()
    fill(181, 175, 215);
    ellipse(70, 70, 25, 25);
    pop()
    
    //planet three which follows the seconds
    push();
    rotate(mappedSec);
    strokeWeight(2);
    fill(38, 13, 52);
    ellipse(50, 50, 10, 10);
    line(0,0,47.5,47.5);
    pop();
    pop();

}

For this project, I wanted to make a simple clock without hands or number. But something similar to how one planet rotates around another in a certain amount of time. So I choose to keep track of hour, minutes and sections with a circle similar to the shapes of the planets. I began with something very complicated but I could not figure out how to do that, so I changed my mind to make something simple and abstract.

Yingying Yan- Looking Outwards-6

An example of showing pattern within random generation

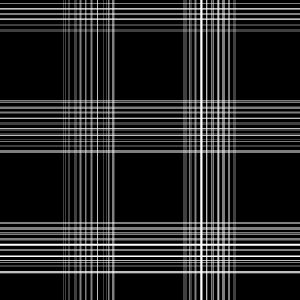
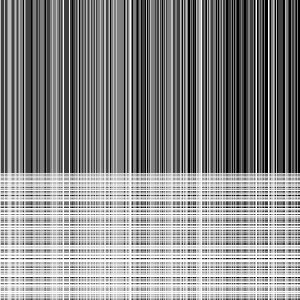
Coding Architecture: Randomness project is an assignment from Rhode Island School of Design. The project I found interesting is not named, nor is not part of the author’s portfolio anymore. Yet, Daejeong Kim uses algorithms to draw sets of lines in a random but systematic way.

The direction is being controlled

For instance, she used two random number set: A and B and centered at random (A, B) to create a drawing with random lines. Due to the algorithm, the lines together form patterns showing density and directionality. It is also interesting to read the product as a animation and see the changes that are generated by the random numbers. This project caught my attention. Because among all the other project, it uses randomness to result in a non-random form.

random fill converted-superhigh from Coding Architecture on Vimeo.

Yingying Yan-Project-05-Wallpaper

sketch

/*
Yingying Yan
Section E
yingyiny@andrew.cmu.edu
Project-05
*/

var oy = 0; // orginal y position
var ox = 0; // original x position 
var tw = 50; // the width spacing
var th = 50; // the height spacing

function setup() {
    createCanvas(585, 600);
    background(234, 185, 83);

}

function draw() {
	// for all the odd rolls and columns, we will draw flowers
	//by calling the x and y position
	for (var y = 0; y < 20; y++) {
	    for (var x = 0; x < 20; x++) {
	    	if((x % 2 == 1) & (y % 2 == 1)){
            var py = oy + y * th;
            var px = ox + x * tw;
            push();
            flower(px, py);
            pop();
        }
    // for all the even rolls and columns, we will draw cactus
    // by changing the x and y position
            if ((x % 2 == 1) & (y % 2 ==1)){
        	var ly = oy + y * th;
        	var lx = ox + x * tw;
        	push();
        	cactus(lx, ly);
        	pop();

        }
    }
}

noLoop();
}

// function that draws the flower with variables x and y
function flower (x,y) {
	translate (x, y);
	scale(0.5)
	for (var i = 0; i < 7; i += 1) {
        fill(147, 87,37, 100);
        noStroke();
		rectMode(CENTER);
		ellipse (0, 0, 20, 100);
		rotate(radians(45));
	}
}

//function that draws cactus and called by variable x and y 
function cactus(x, y) {
    translate(x,y);
    scale(0.5);
    noStroke();
    //the vertical stem
    fill(90,87,36, 140);
	ellipse(100, 100, 10, 100);
    // the left rectangle bend
	push()
	noStroke();
	translate(85,110);
	rotate(radians(30))
	rectMode(CORNER);
	rect(0,0, 20, 8);
	pop();
    //the left ellipse or branch
	push();
	noStroke();
	translate(83, 112);
	rotate(radians(-50));
	ellipse(0,0, 10, 30);
	pop();
    //the branch on the right side
    push();
	translate(100,100)
	rotate(radians(-120));
	ellipseMode(CORNER);
	ellipse(0, 0, 10, 50);
	pop();


}

I wanted to draw minions and bananas, but it was too challenging so I ended up drawing flowers and cactus. I like how I accidentally made my flower transparent, that was cool. Then I basically used assignment B’s method to place my flowers and cactus. This project is a little bit stressful than the other ones. As you can tell I turned this in 5 minutes before it is due.

YingyingYan – LookingOutwards-05

Closer view of the 3D world Tomer created

Somerset Isle is a 3D rendering project done by an environment artist from Vancouver, Tomer Meltser. He got his inspiration from the world heritage site Chew Jetty in Malaysia. The project includes a walkthrough video and a series of images from the rendering. Most of the items he used in the render can be found in the ArtStation website.

The faded background creates an interesting atmosphere.

I was looking at a list of 3D renderings drawings, the spatial atmosphere in Tomer’s image totally caught my attention. The environment he created is very dreamy, has a sense of unrealistic yet realistic at the same time. It is conflicting, but that’s the feeling I got from looking at this project. I know 3D artists use Rhino, Vray, AutoCAD, Photoshop and other software that I am using in the studio right now. But Tomer totally made a new world with all the software! Those tools are so much more powerful than I thought. Maybe he’s 3D graphic did not involve any algorithm, and does not fit the Looking Outward requirement this week. Yet, I think the drawings he made are super cool, so I feel the need to share this.

A larger scale view of the project.

Somerset Isle | Environment Reel 2018 from Tom Meltser on Vimeo.

Yingying Yan – Project 4 – String Art

sketch

/*
Yingying Yan
Section E
yingyiny@andrew.cmu.edu
Project-04
*/
var x; //x1 of the line
var y; //y1 of the line
var x2; //x2 of the line
var y2; // y2 of the line

function setup() {
    createCanvas(400, 300);
    background(0);
}

function draw() {
	//bottom right curve
	for( var a = 0; a < 10; a += .03){
		push();
		//assign color n weight
		stroke(255,255,161);
		strokeWeight(0.003);
		//draw from bottom left corner to top right corner
		x = lerp(0, width, a);
		y = height;
		x2 = width;
		y2 =lerp(height,0,a);
		line(x, y, x2, y2);
		pop();
	}

    //bottom left curve
	for( var b = 0; b < 30; b += .03){
		push();
		stroke(250,170,113);
		strokeWeight(0.003);
		//draw from top left corner to bottom right corner
		x = 0
		y = lerp(0, height, b)
		x2 = lerp(0, width, b);
		y2 = height;
		line(x, y, x2, y2);
		pop();

	}
    //background curve from bottom left corner to top right corner
	for(var e = 0; e < 10; e += 0.04){
		push();
		stroke(255, 244, 200);
		strokeWeight(0.001);
		//just testing what it looks like if all var are lerp
		x = lerp(0, width / 4, e);
		y = lerp(height, 3 * height / 4, e);
		x2 = lerp(3 * width / 4, width, e);
		y2 = lerp(0, height / 4, e);
		line(x, y, x2, y2);
		pop();
	}


    //draw the lighting from one point
	for ( var c = 0; c < 200; c += 10 ){

		push();
		stroke(236, 138,82);
		strokeWeight(0.09);
		// the space and height of the end of the lines
		//change consistently with + and -
		var x = width - c
		var y = height/ 2 + c
		line(0, 0, x, y)
		pop();
	}

    //draw the green lighting from a point
    //the spread of the lines froms a curve
	for (var d = 0; d < 30; d += 1){
			push();
			stroke(133,152,221);
			strokeWeight(0.003);
			//by using exponential function, the end of the lines 
			//do not have to be a straight cut
			var x = Math.pow( d, 2);
			var y = height/ 2 + Math.pow(d,2);
			line( 3 * width / 4, 0, x, y)
			pop();
	}


}


I think it was very interesting testing out lerp. Playing around with line weight and color to create a foreground and background composition was fun. Although I did not carry that all the way. I did not aim to draw a certain image. I was deciding where the curves will be as the project develops. That’s why the composition is weird. If I would have to this again, I think I will try to sketch something first, then draw it.

Yingying Yan LookingOutwards-04

An example of how the data is sorted visually

Sorting is a visualization and sonification project created by Ren Yuan. It is based on 31 algorithms and made using Processing. Basically it allows the viewer to see how the data is sorted and made audible by seven sorting algorithms. They are insertion sort, shell sort, bubble sort, quick sort, selection sort, heap sort and merge sort. This project is very interesting and visually compelling. I love how Ren uses pattern and algorithm to make sorting a list of data on a black and white screen to a piece of digital art that really catches people’s attention. I might not know this project’s performance criteria. But as an art piece, it is successful.

One of the sorting type

Yingying Yan Project 3 Dynamic Drawing

sketch

/*
Yingying Yan
Waitlist for Section E
yingyiny@andrew.cmu.edu
Assignment-02-A
*/

//this code allow you do draw flowers! hold you mouse
//still and see what you get!

var k =4;
var R = 255;

//setup background and allow drawing to show
function setup() {
  createCanvas(480, 640);
  background(230);
}

function draw() {
  //the graphic of the lower right eraser box
  push();
  strokeWeight(0);
  fill(255);
  rect(340, 480, 140,160);
  pop();
  text("erase", 360,520);

  //color of the stokes of the flower
  stroke(R,100,100);
  // position of the drawing = position of the mouse
  translate(mouseX, mouseY);
  // the mouse controls how fast you can draw the flower
  //e.g. smaller x = draw faster
  var speed = frameCount / mouseX;
  // rose formula from Wekipedia and allow the computer
  //to draw the flower
  var x = cos(k*speed) * sin(speed);
  var y = cos(k*speed) * cos(speed); 
  // how big the drawing depends on the Y coordinate of the mouse
  scale(mouseY / 5, mouseY / 5);

  
  // controls the color of the drawing 0f the flower
  R -= .5;
  if (R < 0) {
    R = 255;
  }

  //the circles that draw the flower
  ellipse(x , y,.001,.001);

  //lower right corner of the canvas and clear the 
  //background of the canvas = erase
  if (mouseX > 340 & mouseY > 480) {
    background (230);
  }
}

I wanted to draw something geometrical, so I went online and search for a flower formula. This drawing is based on the rose formula. It took me forever to figure everything out but I am glad that I somehow finished it. I think this project is very interesting, and I wish I have more time and know more code for this.

Yingying Yan LookingOutwards-03

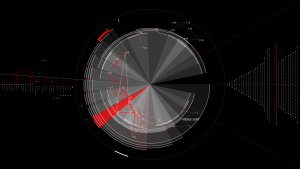
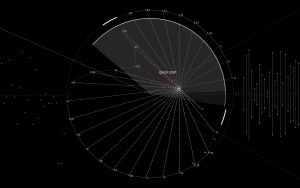
Axon of the building, showing how it responded to the context.

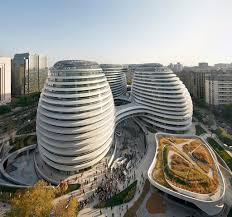
Zaha Hadid is the first female winner of the Pritzker Architecture Prize. She is also one of my favorite architects. She is known for using the computer and making parametric designs. Galaxy Soho, in Beijing, is one of the most representative projects by Zaha Hadid.

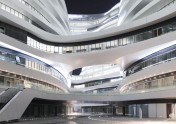
Closer view of the flow of the form.

The design is responsive to the Rings, or the site context. I am most admire about the fact that Zaha was able to control every single curve of the building, and resulted in a piece of art that similar to a Chinese courtyard. The building is used as the office and retail space. It is basically four continuous, flowing volume. I could not find any related algorithm, but I know that Grasshopper is a software that can make building’s like that. It really shows me how powerful computer is these days.

Floor plan of the building, showing how it is one flowing volume.