![[OLD FALL 2020] 15-104 • Introduction to Computing for Creative Practice](https://courses.ideate.cmu.edu/15-104/f2020/wp-content/uploads/2021/09/stop-banner.png)
curves
var r = 0;    //red color variable

var a = 0;    //radius of circle a (inner circle) for parametric function
var b = 0;    //radius of circle b (fixed circle) for parametric function
var h = 0;    //distance from center of inner circle

var theta = 0;    //angle variable

function setup() {
    createCanvas(480, 480);
    background(220);
}

function draw() {

	//changing red level of background
	r = map(mouseX, 0, 480, 0, 255);
    background(r, 200, 200);

    //creates 9 Hypotrochoid curves
    for (var x = 0; x <= 400; x += 160) {
        for (var y = 0; y <= 400; y += 160) {
            push();
            translate(x+80, y+80);
            drawHypotrochoid();
            pop();
        }
    }

    //creates 16 Hypotrochoid Evolute curves
    for (var x = 0; x <= 480; x += 160) {
        for (var y = 0; y <= 480; y += 160) {
            push();
            translate(x, y);
            drawEvolute();
            pop();
        }
    }
}

function drawHypotrochoid() {

    //curve based on the Hypotrochoid equation

    strokeWeight(0.5);
    stroke(255);
    noFill();
    beginShape();

    a = map(mouseX, 0, 480, 1, 70);
    b = map(mouseY, 0, 480, 1, 5);
    h = map(mouseX, 0, 480, 1, 40);

        for (var i = 0; i < 2000; i++) {

            var x = (a-b)*cos(theta) + h*cos((a-b)/b*theta);
            var y = (a-b)*sin(theta) + h*sin((a-b)/b*theta);
            var theta = map(i, 0, 360, 0, TWO_PI);

            vertex(x, y);
        }

    endShape();

    pop();
}

function drawEvolute() {

    //curve based on the Hypotrochoid Evolute equation

    strokeWeight(1);
    stroke(0, 150, 0);

    noFill();
    beginShape();

    a = 8*map(480-mouseX, 0, 480, 1, 30);
    b = 2*map(480-mouseY, 0, 480, 1, 20);
    h = 3*map(480-mouseX, 0, 480, 1, 10);

        for (var i = 0; i < 4000; i++) {

            var x = (a-b)*cos(theta) + h*cos((a-b)/b*theta);
            var y = (a-b)*sin(theta) + h*sin((a-b)/b*theta);
            var theta = map(i, 0, 480, 0, TWO_PI);

            vertex(x, y);
        }

    endShape();

    pop();
}
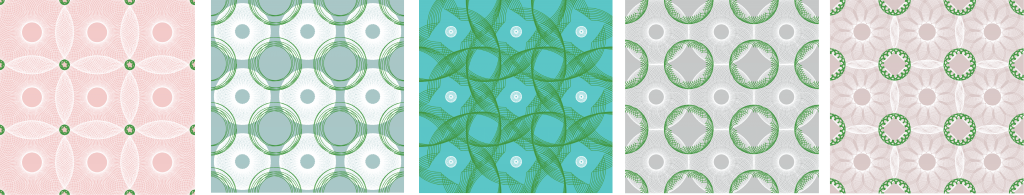
For this project, I tried out a few of the equations from the reference and liked the look of the Hypotrochoid the best. Once I had the Hypotrochoid curve working I want to add some visual interest by replicating them with a loop. Once that was done, I added another curve, the Hypotrochoid Evolute and replicated that with a loop too. After the curves were all in place, I added the changing background. The biggest challenge was understanding how changing the values of variables in the equations effected the curve but once I was able to get that it was fun to mess around with!