![[OLD FALL 2020] 15-104 • Introduction to Computing for Creative Practice](https://courses.ideate.cmu.edu/15-104/f2020/wp-content/uploads/2021/09/stop-banner.png)
On their website, Periscopic brands themselves as a “socially conscious data visualization firm”. They are a team of designers who bring light to societal issues through striking visualizations, such this one, the annual number of gun homicides in the US.
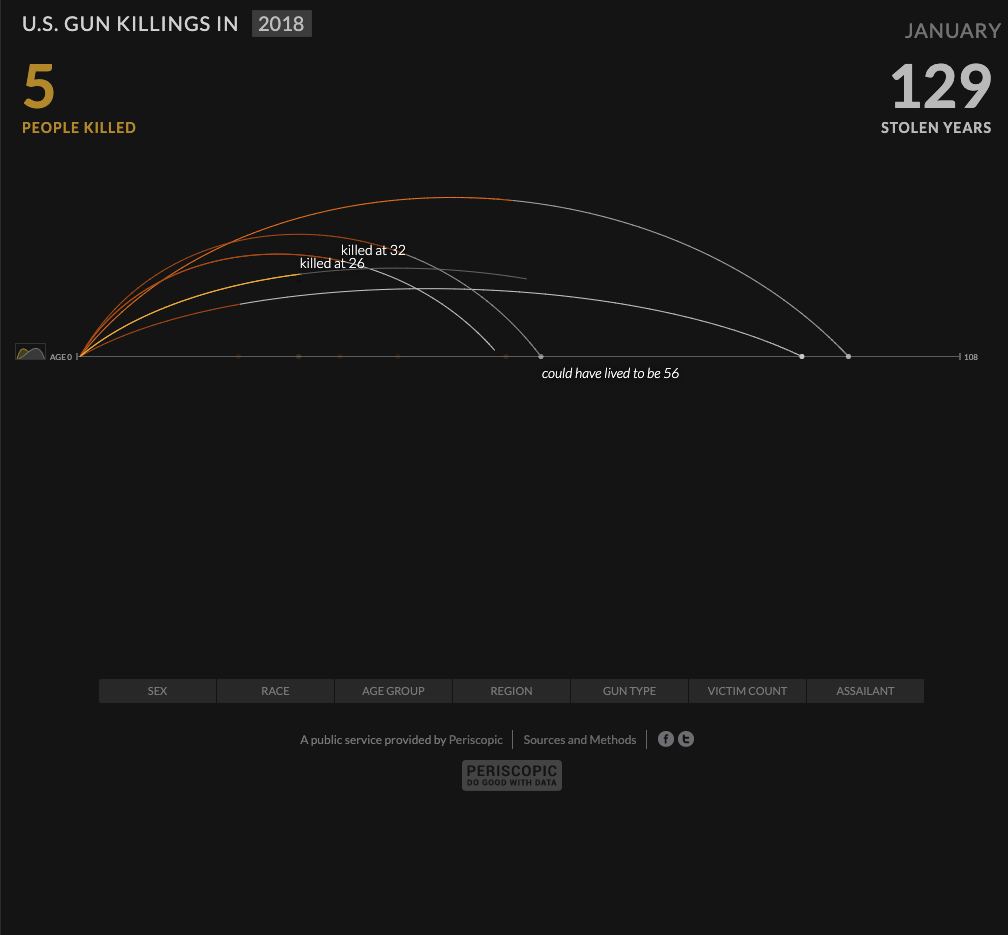
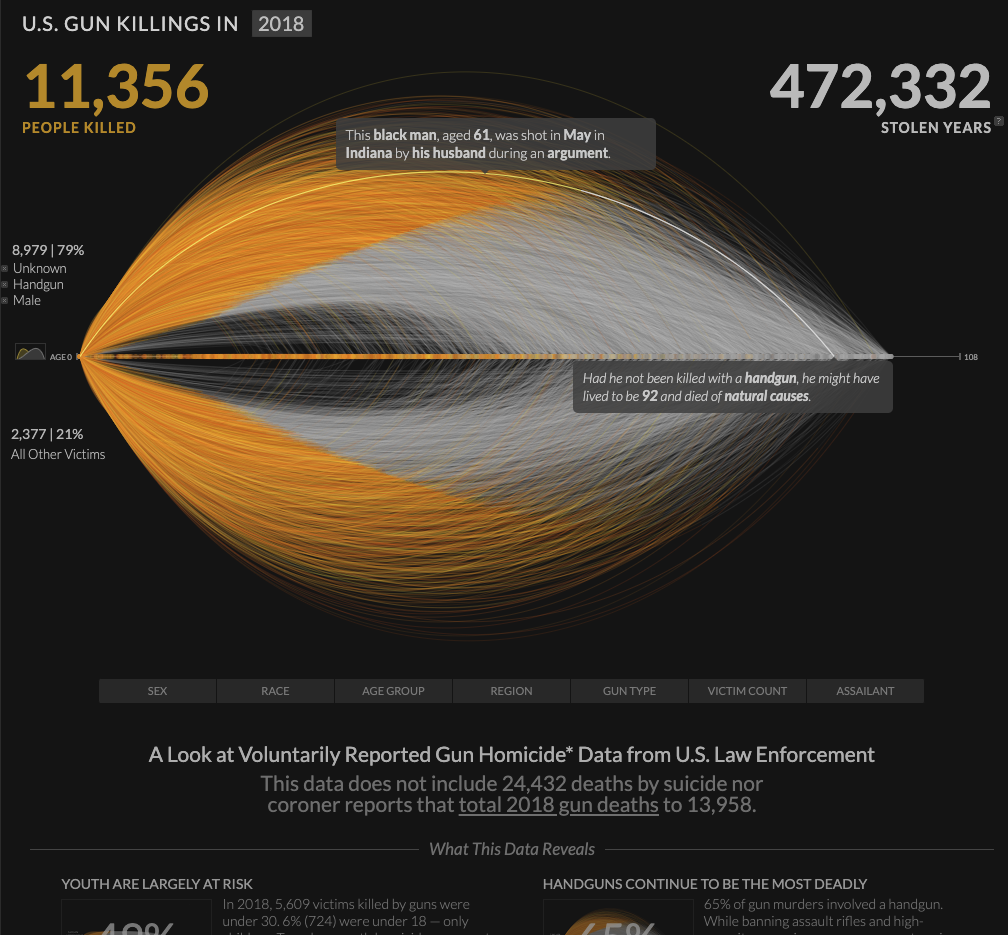
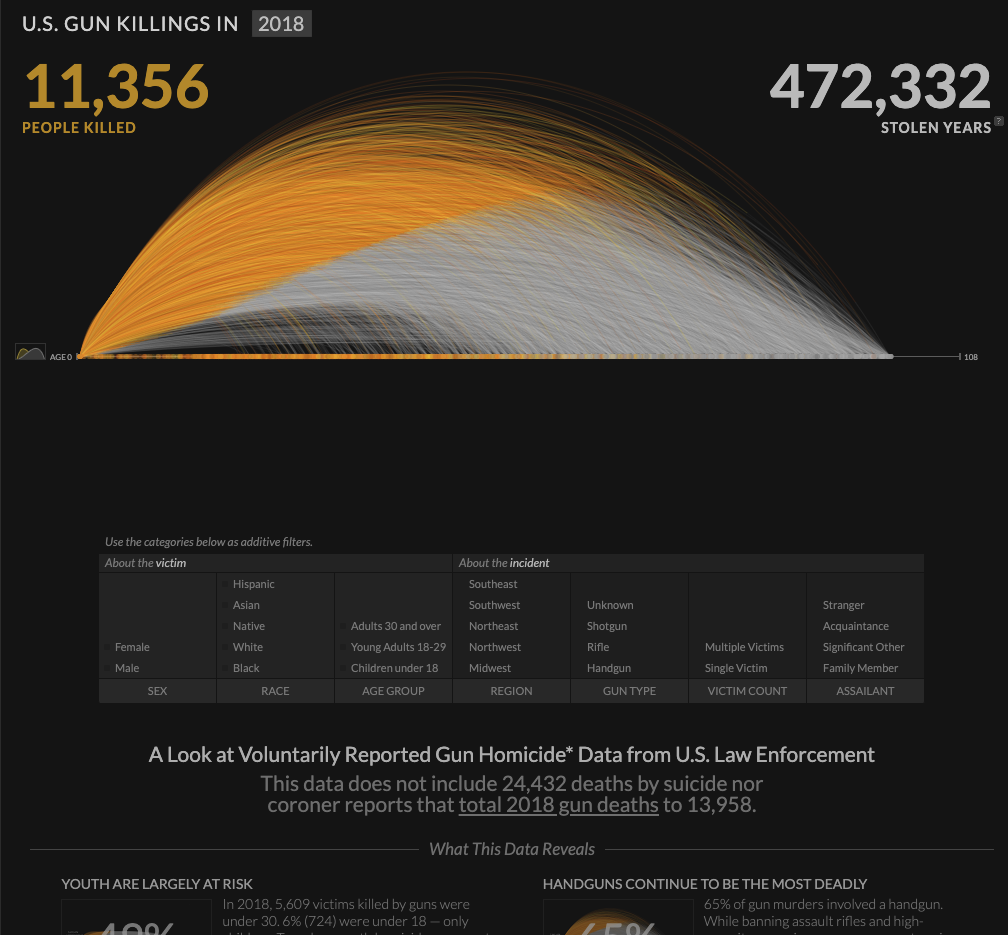
This visualization represents the lives of those lost to a bullet through an arc of time. A victim’s arc starts as a bright orange line and fades to ash gray at the point they were killed, and the arc extends to the point of their expected natural life expectancy. Each arc can be clicked on providing more information about the homicide and expected lifespan. Periscopic mentions that the gun data was in ASCII format originally, making it difficult to extract the data for artists who had little coding experience. They have converted the data into CSV format and shared it freely.
This visualization struck me by how simple yet powerful its message is. Knowing the context of gun killings that this graphic conveys, the way the arcs turn from a passionate orange to lifeless gray is chilling, especially when seeing the vast number of lines form into a faded mass of death. And even if the 2018 death count of 11,356 doesn’t seem like much, the 472,332 lost years of human life makes it clear that gun homicides are a problem we must address.