![[OLD FALL 2020] 15-104 • Introduction to Computing for Creative Practice](../../../../wp-content/uploads/2021/09/stop-banner.png)
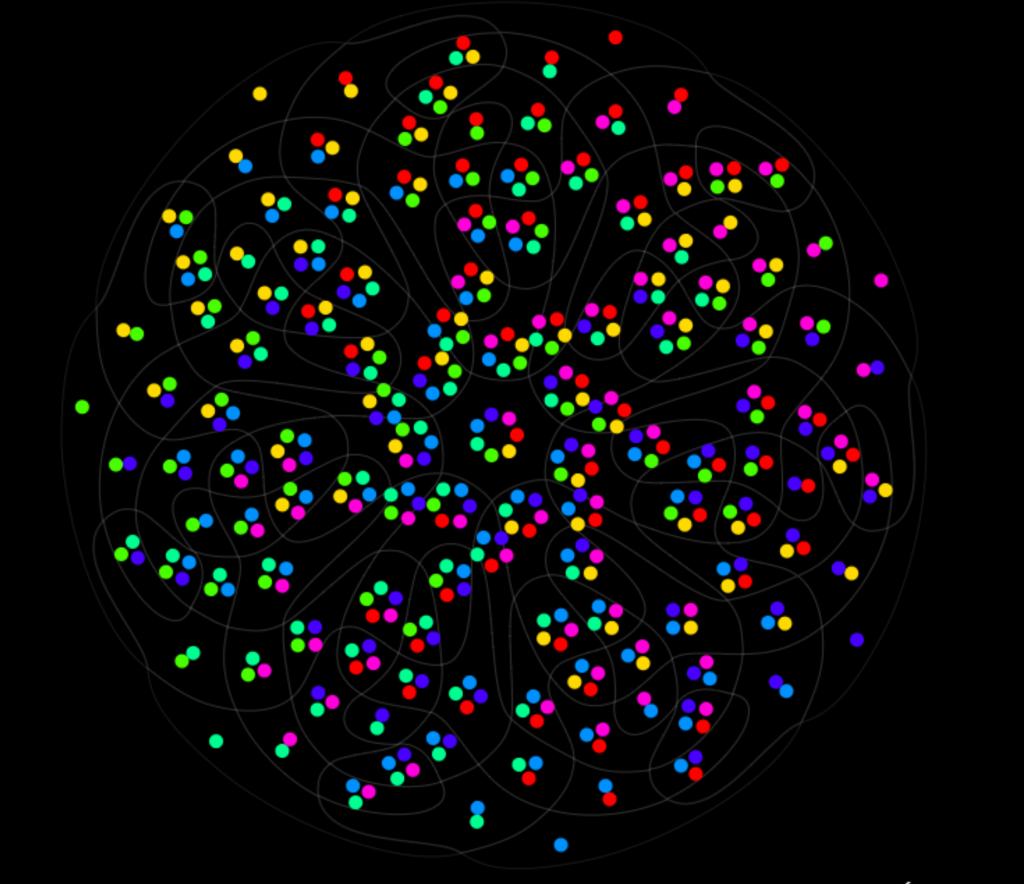
Of the examples I looked at, I really enjoyed the 7 sets Venn Diagram, made by Santiago Ortiz’s Moebio Labs. I really like that they use colors instead of numbers or letters, since it makes the intersections between the different sets much simpler to understand. The work was created by looking at a static set of the 7 way Venn Diagram, and using the shapes as a base to create an interactive version. Similar to much of the other work on the Moebio website, they use a lot of color, specifically intersections of color, in order to help with visualization and gradients between zones. I think that it is also great that they didn’t stop at the first success, and went on to add a second side of the diagram which consists of only the gradients of different colors.