Final Project – social distance

sketch

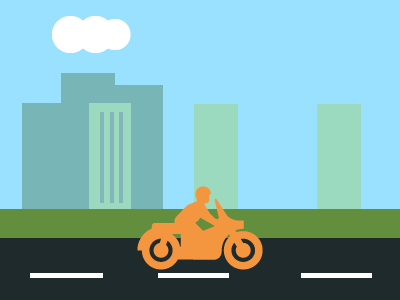
I created a interactive game about Covid-19. When the program runs, it first gives the instruction of the game for the first few seconds, You have to click on the heads of the humans to remove them, so that they keep social distance. If you successfully keep the number of the people under 4, you succeed. If you fail to do so and there are more than 12 people, game over. I was inspired by how the social distance is crucial to keep us safe during this time of pandemic. We just have to keep ourselves not too crammed in one place! I wish I could add more interactive/intuitive features including click to start or click to restart the game.

//Jae Son , Section C

var humans = []; 

function setup() {
    createCanvas(500, 400);
    rectMode(CENTER);
    frameRate(20);
}

function draw() {
    background(210,237,178);
    
    for (var i = 0; i < humans.length; i++){
      var human = humans[i];
      humans[i].display();
    }
    //game instruction in the beginning
    if (frameCount <80) {
      noStroke();
      fill(152,183,108);
      rect(250,200,300,200);
      fill(255);
      textSize(20);
      textStyle(BOLD);
      text('click the head and',140,180);
      text('remove the humans to',140,200);
      text('keep the social distance',140,220);
    }
    //game starts after the instruction
    if (frameCount > 80 & frameCount % 10 == 0){
      var newHuman = createHuman(random(25,476),random(10,278),0,0);
      humans.push(newHuman);
    } 
    //if there is more than 12 people, game over
    if (humans.length > 12) {
      fill(242,158,158);
      rect(250,200,350,250);
      fill(255);
      textSize(20);
      textStyle(BOLD);
      text('No one bothered to keep',130,140);
      text('the social distance',130,160);
      text('and Now we are at the',130,180);
      text('highest risk of COVID 19.',130,200);
      text('Try better!',130,240);
      frameRate(0);
    } 
    //if there is less than 4 people, game clear
    if (humans.length < 4 & frameCount > 200){
      fill(157,209,244);
      rect(250,200,300,250);
      fill(255);
      textSize(20);
      textStyle(BOLD);
      text('Everyone kept the',140,140);
      text('social distance and',140,160);
      text('and we are at',140,180);
      text('lower risk of COVID 19.',140,200);
      text('Good job!',140,240);
      frameRate(0);
    }
}


//humans

//creating Human objects and drawing them
function createHuman(humanx,humany,humandx,humandy){
  var human = {x: humanx, y: humany,
               dx: humandx, dy: humandy,
               display: drawHuman,
               humancolor: color(random(220,255),random(80,100),random(100,200))
              }
  return human;
}

function drawHuman(){
    noStroke();
    fill(this.humancolor);
    push();
    ellipse(this.x,this.y,15,15);
    rect(this.x,this.y+22,16,27);
    rect(this.x-12,this.y+22,4,22);
    rect(this.x+12,this.y+22,4,22);
    rect(this.x-3,this.y+52,5,33);
    rect(this.x+3,this.y+52,5,33);
    pop();
}

//remove humans when their head is clicked
function mousePressed() {
  for (var i = humans.length - 1; i >= 0; i--) {
    if (dist(humans[i].x, humans[i].y, mouseX, mouseY) < 20) {
      humans.splice(i, 1);
    }
  }
}


Looking Outwards 11

Looking Outwards 11: A Focus on Women Practitioners

This week, I took a look at Nathalie Miebach’s Sculptural Musical Scores, “Weather Score Project.” She translated weather data into musical scores, and then translate those into sculptures. It is a mapped meteorological conditions of a specific time and place, and functional musicals scored played by musicians as well. Nathalie studied political science, art education, visual arts, astronomy, physics, and sculpture. She is now an innovator in residence at Rutgers University. She has been working a lot with data and translating them into artistic forms. This Weather Score project was particularly interesting to me because of its interesting translation between different medium. It is very interesting how she translated a set of data into a visual art form, and then translated them into a musical art form. I was amazed by how borderless it is between the different kinds of arts and medium. I like how she takes a meaningful data and make them more interesting in their forms.

http://nathaliemiebach.com/musical28.html

http://nathaliemiebach.com/weatherscores.html

Project 11 Landscape

sketch
sketch for the composition
//Jae Son, section C 

var bike;
var clouds = [];
var buildings1 = [];
var buildings2 = [];
var lines = [];

function preload(){
  bike = loadImage("https://i.imgur.com/NCg0ju7.png");
}

function setup() {
    createCanvas(400, 300);
    background(11,92,146);
    var cloudn = 0;
    var building1n = 0;
    var building2n = 0;
    var linesn = 0;
    for (var i = 0; i < 500; i++) {
      clouds[i] = createCloud(cloudn);
      cloudn += 180;
      buildings1[i] = createBuilding1(building1n);
      building1n += 140;
      buildings2[i] = createBuilding2(building2n);
      building2n += 110;
      lines[i] = createlines(linesn);
      linesn += 400;
    }
    frameRate(15);
}

function draw() {
  imageMode(CENTER);
  background(153,225,254);
  noStroke();
  //cloud displayed
  displayCloud();
  //back layer buildings displayed
  displayBuilding1();
  //front layer buildings displayed
  displayBuilding2();
  //green ground
  fill(98,142,62);
  rect(0,209,width,91);
  //dark gray road
  fill(31,42,45);
  rect(0,238,width,62);
  //white line on the road displayed
  displaylines();
  //person on the bike
  image(bike,200,228,125,83);
}

//cloud
function displayCloud(){
  for (var i = 0; i < clouds.length; i++){
    clouds[i].move();
    clouds[i].display();
  }
}

function moveCloud() {
  this.x += this.speed;
}

function createCloud(cloudx){
  var cloud = {x: cloudx,
               cloudy: random(20,70), //so the y coordinate of the clouds vary
               cloudw: random(28,42), //so the size of the clouds vary
               speed: -3.0,
               move: moveCloud,
               display: drawCloud
               }
  return cloud;
}

function drawCloud(){
  noStroke();
  push();
  fill(255);
  ellipse(this.x-20,this.cloudy,this.cloudw,this.cloudw);
  ellipse(this.x,this.cloudy,this.cloudw,this.cloudw);
  ellipse(this.x+20,this.cloudy,this.cloudw,this.cloudw);
  pop();
}

//back layer buildings
function displayBuilding1(){
  for (var i = 0; i < buildings1.length; i++){
    buildings1[i].move();
    buildings1[i].display();
  }
}

function moveBuilding1() {
  this.x += this.speed;
}

function createBuilding1(buildingx){
  var building1 = {x: buildingx,
               building1ay: 106,
               building1aw: 40,
               building1ah: 133,
               building1by: 91,
               building1bw: 54,
               building1bh: 126,
               building1cy: 117,
               building1cw: 48,
               building1ch: 140,
               speed: -8.5,
               move: moveBuilding1,
               display: drawBuilding1
               }
  return building1;
}

function drawBuilding1(){
  noStroke();
  push();
  fill(119,181,183);
  rect(this.x,this.building1ay,this.building1aw,this.building1ah);
  rect(this.x+40,this.building1by,this.building1bw,this.building1bh);
  rect(this.x+92,this.building1cy,this.building1cw,this.building1ch);
  pop();
}

//front layer buildings
function displayBuilding2(){
  for (var i = 0; i < buildings2.length; i++){
    buildings2[i].move();
    buildings2[i].display();
  }
}

function moveBuilding2() {
  this.x += this.speed;
}

function createBuilding2(building2x){
  var building2 = {x: building2x,
               building2y: random(100,140),
               building2w: random(30,50),
               building2h: random(100,145),
               speed: -6.5,
               move: moveBuilding2,
               display: drawBuilding2
               }
  return building2;
}

function drawBuilding2(){
  noStroke();
  push();
  //building structure
  fill(156,218,191);
  rect(this.x,this.building2y,this.building2w,this.building2h);
  //windows (strips) on the building
  fill(130,182,187);
  rect(this.x+this.building2w/7,this.building2y+this.building2h*0.1,this.building2w/7,this.building2h*0.8);
  rect(this.x+this.building2w*3/7,this.building2y+this.building2h*0.1,this.building2w/7,this.building2h*0.8);
  rect(this.x+this.building2w*5/7,this.building2y+this.building2h*0.1,this.building2w/7,this.building2h*0.8);
  pop();
}

//white lines on the road
function displaylines(){
  for (var i = 0; i < lines.length; i++){
    lines[i].move();
    lines[i].display();
  }
}

function movelines() {
  this.x += this.speed;
}

function createlines(linesx){
  var lines = {x: linesx,
               linesy: 273,
               linesw: 73,
               linesh: 5,
               speed: -7.0,
               move: movelines,
               display: drawlines
               }
  return lines;
}

function drawlines(){
  noStroke();
  push();
  fill(255);
  for (i = 0; i < 3; i++) {
    fill(255);
    rect(this.x+135*i,this.linesy,this.linesw,this.linesh);
  }
  pop();
}

Project 10 Sonic Story

Story: it rains (rain sound plays), and the sprout grows (grow sound plays) and bloom the flower (bloom sound plays). Then, the cloud clears up and the bird goes by (bird sound plays). At the end, the sun gets bigger (ending sound plays).

sketch

//Jae Son
//Section C
//story: it rains, and the sprout grows and bloom the flower. 
// Then, the cloud clears up and the bird goes by. 
// At the end, the sun gets bigger

var rain;
var grow;
var bloom;
var bird;
var sun;
var sprout;
var flower;
var birdimg;
var sunimg;

function preload() {
  //sounds
  rain = loadSound("https://courses.ideate.cmu.edu/15-104/f2020/wp-content/uploads/2020/11/rain.wav");
  grow = loadSound("https://courses.ideate.cmu.edu/15-104/f2020/wp-content/uploads/2020/11/grow.wav");
  bloom = loadSound("https://courses.ideate.cmu.edu/15-104/f2020/wp-content/uploads/2020/11/bloom.mp3");
  bird = loadSound("https://courses.ideate.cmu.edu/15-104/f2020/wp-content/uploads/2020/11/bird.wav");
  sun = loadSound("https://courses.ideate.cmu.edu/15-104/f2020/wp-content/uploads/2020/11/sun.wav");
  //images
  sprout = loadImage("https://i.imgur.com/jhYJcR1.png");
  flower = loadImage("https://i.imgur.com/o6nzV38.png");
  birdimg = loadImage("https://i.imgur.com/amZXis1.png");
  sunimg = loadImage("https://i.imgur.com/2W1rzB0.png");
}

function setup() {
  createCanvas(600, 400);
  useSound();
  frameRate(20); 
}

function soundSetup() { // setup for audio generation
  rain.setVolume(0.6);
}

function draw() {
  //blue background
  background(189,209,255); 
  noStroke();
  imageMode(CENTER);
  
  //animation
    if (frameCount < 5) {
        cloud(200,100);
        image(sprout,width/2,height-20,67,104);
    } else if (frameCount >= 5 & frameCount <10) {
        raindrop(250,150,0);
        cloud(200,100);
        image(sprout,width/2,height-20,67,104);
    } else if (frameCount >= 10 & frameCount <15) {
        raindrop(250,150,100);
        cloud(200,100);
        image(sprout,width/2,height-20,67,104);
    } else if (frameCount >= 15 & frameCount <50) {
        raindrop(250,150+frameCount*3,255);
        cloud(200,100);
        image(sprout,width/2,height-20,67,104);
    } else if (frameCount >= 50 & frameCount < 100) {
        cloud(200,100);
        image(sprout,width/2,height-50-frameCount/3,67,104);
    } else if (frameCount >= 100 & frameCount < 110){
        cloud(200,100);
        image(flower,width/2,height-80,67,104);
    } else if (frameCount >= 110 & frameCount < 270){
        image(sunimg,width/2,100,90,90);
        cloud(400-frameCount*2,100);
        image(flower,width/2,height-80,67,104);
        image(birdimg,-200+frameCount*3,200,84,57);
    } else if (frameCount >=270 & frameCount <300){
        image(sunimg,width/2,100,70+frameCount/5,70+frameCount/5)
        image(flower,width/2,height-80,67,104);
    } else {
        image(sunimg,width/2,100,130,130);
        image(flower,width/2,height-80,67,104);
    }
    
  //brown ground
    fill(165,85,85);
    rect(0,height-40,600,40);
    
  //sound play
    if (frameCount == 2) {
      rain.play();
    } else if (frameCount == 50) {
      grow.play();
    } else if (frameCount == 102) {
      bloom.play();
    } else if (frameCount == 110) {
      bird.play();
    } else if (frameCount == 250) {
      bird.stop();
    } else if (frameCount == 270) {
      sun.play();
    }
    
}

function cloud(x,y) { //cloud shape draw
  push();
  translate(x,y);
  noStroke();
  fill(235,242,255);
  ellipse(0,0,100);
  ellipse(87,0,115);
  ellipse(160,0,95);
  pop();
}

function raindrop(x,y,t) { //rain drops shape draw
  push();
  rectMode(CENTER);
  translate(x,y);
  noStroke();
  fill(100,178,255,t);
  rect(0,10,10,50);
  rect(40,0,10,50);
  rect(80,15,10,50);
  pop();
}


Looking Outwards 10

Jae Son
Section C

Looking Outwards 10: Computer Music

For this LO-10, I looked at Laetitia Sonami’s Magnetic Memories. She created this new instrument “Spring Spyre,” with Rebecca Fiebrink’s neural networks. According to the Stanford University’s CCRMA stage brochure, in which she performed, “the audio signals from three pickups attached to springs are fed to the neural networks, which are trained to control the live audio synthesis in MAXMSP.” So, with the performer’s real-time performance, somewhat chaotic set of sound is produced. I admire how a random, real-time physical performance produces sound that sounds chaotic but is within the programmed pattern. I like the intersection of installation, performance art, and computer art come together.

Project-09-Portrait

sketch

I chose the photo I took in LA. So, I decided it to draw and color with the text “LA” according to the mouse position, along with the pixels draw and color with the rectangle.

original photo
after first few seconds
after few minutes
after few more minutes

//Jae Son , Section C

var Jae;

function preload() { 
  var imageURL = "https://i.imgur.com/BGjhuqC.jpg";
  Jae = loadImage(imageURL);
}

function setup() {
  createCanvas(480, 480);
  background(255);
  frameRate(10000);
  Jae.loadPixels();  
  Jae.resize(480,480);
}

function draw() {
  
 var x = random(width);
 var y = random(height);
  
 var ix = constrain(floor(x), 0, width);
 var iy = constrain(floor(y), 0, height);
  
 var clr = Jae.get(x, y);
 var mouseclr = Jae.get(mouseX, mouseY);
  
//fill and color pixels with rectangle
 noStroke();
 fill(clr);
 rect(x,y,10,10);
  
//draw and color text "LA" at my mouse location
 fill(mouseclr);
 textSize(16);
 textStyle(BOLD);
 text("LA",mouseX,mouseY);
}

Looking Outwards 09: on Looking Outwards

Looking Outwards 09: on Looking Outwards

Looking at other students’ looking outwards posts, I found the looking outwards 06: randomness post by the username “catbug” interesting. The work he/she talks about it Robbie Barrat’s Neural Network Balenciaga series. Barrat produced a random image by analyzing the similarities in thousands images from Balenciaga runway and interpret the patterns in those. I agree with him/her that it is very interesting and admirable that this project throws the whole concept of randomness into question; that they are series of randomly generated images yet look so similar to each other and look so consistent in the style. I wonder if it is a similar concept to the average. Analyzing thousands of images of Balenciaga runway and lookbook may have allowed the algorithm/system to find out the patterns in the clothes and find out the “average” of the aspects of the Balenciaga style and that led to generating the most “Balenciaga” images.

https://flaunt.com/content/ai-fashion

Looking Outwards 08

Looking Outwards 08: The Creative Practice of an Individual

Catherine D’Ignazio’s Feminist Data, Feminist Futures lecture was interesting to me. Catherine is a professor at MIT, artist, and software developer who focuses on feminism and data literacy. She is from North Carolina and studied International Relations at Tufts University and received master degree in Studio Art, Design and Theory from Maine College of Art and a Master degree in Media Arts and Sciences from MIT. She has a variety of Art and Science background. In the beginning of her talk at Eyeo 2019, she talks about how “we often our work is looking 20 or 30 years into the future, what relationship between the human and technology will look like.” Her works embrace this idea. Her work “Data Feminism” was particularly interesting. Is is very interesting how she takes a feminist approach to data science. She focuses on how to put the data in the service of justice. I think this idea is admirable and fascinating that she is intersecting a humanities principle, feminism, with data science. I like how her work takes an approach in which to be more inclusive. Her other work, DataBasic.io is interesting too. One of the tools included in DataBasic.io is the WTFcsv, which is a web application that returns a summary of the fields, data type, range, and basic descriptive statistics of a CSV file. This tool helps to fill the significant gaps for people who do not know how to code and to help them understand data more easily. I like how she approaches the data science with humanitatrian view to make it more accessible to more people. I would like to create a work like hers, incorporating different aspects and perspectives to the data science.

link to Catherine’s portfolio

Project 7 Curves

sketch

var numpoints = 200;

function setup() {
    createCanvas(400, 400);
    frameRate(10);
    noStroke();
}


function draw() {
    background(14,0,54);
    noFill();

    for (i = 1; i < 4; i+=2) { //two left deltoids
    strokeWeight(0.3);
    stroke(201,255,175);
    push();
    translate(width/4,height*i/4);
    deltoid();
    pop();
    }
 
    for (i = 1; i < 4; i+=2) { //two right deltoids
    strokeWeight(0.3);
    stroke(201,255,175);
    push();
    translate(width*3/4,height*i/4);
    deltoid();
    pop();
    }
    
    var c = color(255,202,map(mouseX,0,width,150,225)); // color change for the cornoid
    push();
    strokeWeight(1);
    stroke(c);
    translate(width/2,height/2);
    cornoid();
    pop();
}

function cornoid() {
  var x;
  var y;
  var a = map(mouseX,0,width,100,200); //a value changes according to mouseX, and mapping the value 
  
  beginShape();
  for (var i = 0; i < numpoints; i++ ) {
    var t = map(i, 0, numpoints, mouseY, 200); //theta changes according to the mouseY
    x = a*cos(t)*(1-2*sin(t)*sin(t));
    y = a*sin(t)*(1-2*cos(t)*cos(t));
    rotate(mouseY); //rotating according to mouseY
    vertex(x,y);
  }
  endShape();
}

function deltoid() {
  var x;
  var y;
  var a = map(mouseY,0,height,10,60); //a value changes according to mouseY, and mapping the value 
  
  beginShape();
  for (var i = 0; i < numpoints; i++ ) {
    var t = map(i, 0, numpoints, 0, mouseX); //theta changes according to the mouseX
    x = a/3*(2*cos(t)+cos(t*2));
    y = a/3*(2*sin(t)-sin(t*2));
    rotate(mouseY); //rotating according to mouseY
    vertex(x,y);
  }
  endShape(CLOSE);
}

Looking Outwards 07: Information Visualization

Looking Outwards 07: Information Visualization

Santiago Ortiz’s Lostalgic was interesting to me. He visualized all the scripts of ABC’s LOST TV show. It is interesting to see how a lot of text is organized and visualized in an interesting format. I like how the text data is translated into interactive visual experience. It is interesting to see heavy data at a glance, and also be able to look closely into the details. I am not sure of what kind of algorithms that generated the work, but I suppose he used some kind of conditionals and loops to organize the data into different episodes and scenes. This work is an interesting experience in which I can read the series in a different, interactive way.

http://intuitionanalytics.com/other/lostalgic/