Final Project

sketch
/*
Lauren Kenny
lkenny@andrew.cmu.edu
Section A

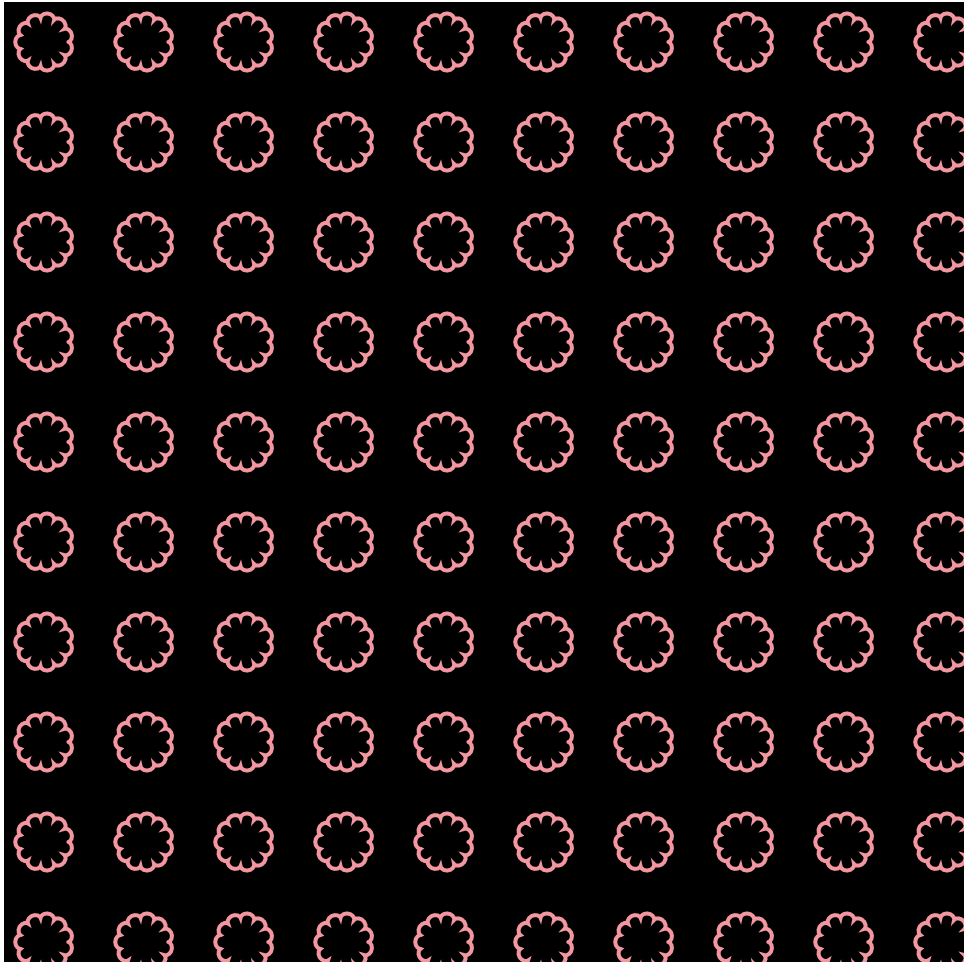
This program draws a grid of masks and covid particles.

*/

// ARRAY OF IMAGE LINKS
var objectLinks = [
    "https://i.imgur.com/1GlKrHl.png",
    "https://i.imgur.com/EJx0rn7.png",
    "https://i.imgur.com/uz2coXH.png",
    "https://i.imgur.com/rxFAYmh.png",
    "https://i.imgur.com/SWkTR5H.png",
    ]

// ARRAY TO STORE LOADED IMAGES
var objectImages = [];

// ARRAYS TO STORE RELEVANT IMAGE VALUES
var objectX = [0, 0, 0, 0, 0];
var objectY = [0, 0, 0, 0, 0];
var objectW = [672/8, 772/5, 847/5, 841/5, 744/8];
var objectH = [656/8, 394/5, 323/5, 410/5, 828/8];

// LOADS IMAGES
function preload() {
    for (var i=0; i<objectLinks.length; i++) {
        objectImages.push(loadImage(objectLinks[i]));
    }
}

function setup() {
    createCanvas(800, 500);
    frameRate(4);
}

function draw() {
    background(180);
    var x=0;
    var y=0;
    // CREATES A GRID OF MASK/COVID IMAGES
    for (let rows=0; rows<=height; rows+=100) {
        x=0;
        for (let cols=0; cols<=width; cols+=150) {
            i = int(random(0, objectImages.length));
            image(objectImages[i], x, y, objectW[i], objectH[i]);
            x+=150;
        }
        y+=100;
    }

    // WHEN THE MOUSE IS PRESSED, TEXT APPEARS
    if (mouseIsPressed) {
        fill(0, 0, 0, 200);
        rect(0, 0, width, height);
        fill(255);
        textSize(35);
        text('beware of covid', width/3, height/2);
        }   
}


Project 11-Landscape

sketch
/*
Lauren Kenny
lkenny@andrew.cmu.edu
Section A

This draws a moving scene.
*/

var buildings = [];
var clouds = [];
var hills = [];
var noiseParam=0;
var noiseStep=0.05;


function setup() {
    createCanvas(480, 300); 
    
    // create an initial collection of buildings
    for (var i = 0; i < 5; i++){
        var rx = random(width);
        buildings[i] = makeBuilding(rx);
    }
    frameRate(10);

    // create an initial collection of clouds
    for (var i = 0; i < 10; i++){
        var rx = random(width);
        clouds[i] = makeCloud(rx);
    }

    // creates initial hills
    for (var i=0; i<width/5; i++) {
        var n = noise(noiseParam);
        var value = map(n, 0, 1, 0, height);
        hills.push(value);
        noiseParam+=noiseStep;
    }

}


function draw() {
    background(255,140,102);
    // draws outline around canvas
    stroke(0);
    strokeWeight(10);
    fill(255,140,102);
    rect(0,0,width,height);

    // draws sun
    strokeWeight(3);
    fill(183,52,52);
    circle(width/2,height/1.2,400);
    fill(229,134,81);
    circle(width/2,height/1.2,300);
    fill(225,185,11);
    circle(width/2,height/1.2,200);
    
    
    // begins the hill shape
    var x=0;
    stroke(0);
    strokeWeight(3);
    fill(93, 168, 96);
    beginShape();
    curveVertex(0, height);
    curveVertex(0, height);
    // loops through each of the values in the hills array
    for (i=0; i<hills.length; i++) {
        curveVertex(x, hills[i]);
        x+=15;
    }
    curveVertex(width, height);
    curveVertex(width, height);
    endShape();
    //removes the first value from the list and appends a new one
    //onto the end to make the terrain move
    hills.shift();
    var n = noise(noiseParam);
    var value = map(n, 0, 1, 0, height);
    hills.push(value);
    noiseParam+=noiseStep;

    displayHorizon();

    updateAndDisplayBuildings();
    removeBuildingsThatHaveSlippedOutOfView();
    addNewBuildingsWithSomeRandomProbability();

    updateAndDisplayClouds();
    removeCloudsThatHaveSlippedOutofView();
    addNewCloudsWithSomeRandomProbability();

    
}


function updateAndDisplayBuildings(){
    // Update the building's positions, and display them.
    for (var i = 0; i < buildings.length; i++){
        buildings[i].move();
        buildings[i].display();
    }
}

function updateAndDisplayClouds() {
    // update the clouds' positions and display them
    for (var i=0; i<clouds.length; i++) {
        clouds[i].move();
        clouds[i].display();
    }
}


function removeBuildingsThatHaveSlippedOutOfView(){
    // If a building has dropped off the left edge,
    // remove it from the array.  This is quite tricky, but
    // we've seen something like this before with particles.
    // The easy part is scanning the array to find buildings
    // to remove. The tricky part is if we remove them
    // immediately, we'll alter the array, and our plan to
    // step through each item in the array might not work.
    //     Our solution is to just copy all the buildings
    // we want to keep into a new array.
    var buildingsToKeep = [];
    for (var i = 0; i < buildings.length; i++){
        if (buildings[i].x + buildings[i].breadth > 0) {
            buildingsToKeep.push(buildings[i]);
        }
    }
    buildings = buildingsToKeep; // remember the surviving buildings
}

function removeCloudsThatHaveSlippedOutofView() {
    var cloudsToKeep = [];
    for (var i=0; i<clouds.length; i++) {
        if (clouds[i].x + clouds[i].width>0) {
            cloudsToKeep.push(clouds[i]);
        }
    }
    clouds = cloudsToKeep;
}


function addNewBuildingsWithSomeRandomProbability() {
    // add a new building
    var newBuildingLikelihood = 0.007; 
    if (random(0,1) < newBuildingLikelihood) {
        buildings.push(makeBuilding(width));
    }
}

function addNewCloudsWithSomeRandomProbability() {
    // add a new cloud
    var newCloudLikelihood = 0.001;
    if (random(0,1) < newCloudLikelihood) {
        clouds.push(makeCloud(width));
    }
}


// method to update position of building every frame
function buildingMove() {
    this.x += this.speed;
}

// updates the position of every cloud frame
function cloudMove() {
    this.x += this.speed;
}
    

// draw the building and some windows
function buildingDisplay() {
    var floorHeight = 20;
    var bHeight = this.nFloors * floorHeight; 
    fill(53,156,249); 
    stroke(0);
    strokeWeight(3); 
    push();
    translate(this.x, height - 40);
    rect(0, -bHeight, this.breadth, bHeight);
    fill(255);
    //rect(this.breath/2, bHeight-20, this.breath/5, bHeight/5);
    rect(5, -35, 10, (bHeight/5));
    pop();

}

function cloudDisplay() {
    fill(255);
    noStroke();
    //stroke(0);
    //strokeWeight(3);
    push();
    //translate(this.x, height-40);
    ellipse(this.x, this.y, this.width, this.height);
    ellipse(this.x+this.width/2, this.y+3, this.width, this.height);
    ellipse(this.x-this.width/2, this.y+3, this.width, this.height);
    pop();
}


function makeBuilding(startX) {
    var bldg = {x: startX,
                breadth: 50,
                speed: -1.0,
                nFloors: round(random(2,8)),
                move: buildingMove,
                display: buildingDisplay}
    return bldg;
}

function makeCloud(startX) {
    var cloud = {x: startX,
                y: random(20,90),
                width: random(10,20),
                height: random(10,20),
                speed: -1.0,
                move: cloudMove,
                display: cloudDisplay}
    return cloud;
}


function displayHorizon(){
    noStroke();
    fill(155,27,66);
    rect(0, height-50, width, 50);
    stroke(0);
    strokeWeight(3);
    line (0, height-50, width, height-50);

}

Looking Outward-11

This project is called Botanicals. It was created by Kate Hartman as a way to form a stronger connection between humans and plants. This project uses Arduino and other software to read what a plant needs and then communicate that to its human. I love that this project plays on something light and funny, but also very relevant and useful. Kate Hartman is based in Toronto and teaches at OCAD University about Wearable and Mobile Technology.

Project 10-Sonic Story

project-10-sonicStory
/*
Lauren Kenny
lkenny@andrew.cmu.edu
Section A

This program creates a sonic story that shows a short food chain.

*/

var chew;

function preload() {
    beetleimg = loadImage("https://i.imgur.com/shXn6SX.png");
    quailimg = loadImage("https://i.imgur.com/Zd4T90e.png");
    coyoteimg = loadImage("https://i.imgur.com/W7IHE01.png");
    chew = loadSound("https://courses.ideate.cmu.edu/15-104/f2020/wp-content/uploads/2020/11/chew.wav");
}

function setup() {
    createCanvas(300, 100);
    frameRate(10);
    useSound();
}

function soundSetup() { 
    chew.setVolume(0.5);
}

function draw() {
    background(217, 233, 250);
    drawBerries();
    drawBeetle();
    if (frameCount==69 || frameCount==125 || frameCount==190) {
        chew.play();
    }
}


function drawBerries() {
    var size=10;
    var xpos=20;
    for (var i=0; i<3; i++) {
        var ypos=70;
        fill(15, 30, 110);
        noStroke();
        push();
        if (i==1) {
            ypos=ypos-5;
        }
        circle(xpos, ypos, size);
        xpos+=5;
    }
}

var beetleX=300;
var beetleY=40;
function drawBeetle() {
    var beetleW = 51.1;
    var beetleH = 41.7;
    image(beetleimg, beetleX, beetleY, (beetleW), (beetleH));
    if (beetleX!=10) {
        beetleX-=5;
    }
    else if (beetleX==10) {
        chew.play();
        drawQuail();
    }
}

var quailX=300;
var quailY=40;
function drawQuail() {
    chew.stop();
    var quailH = 60;
    var quailW = 61.9;
    image(quailimg, quailX, quailY, (quailW), (quailH));
    if (quailX!=10) {
        quailX-=5;
    }
    else if (quailX==10) {
        drawCoyote();
    }
}

var coyoteX=300;
var coyoteY=30;
function drawCoyote() {
    var coyoteW = 153.2;
    var coyoteH = 90.2;
    image(coyoteimg, coyoteX, coyoteY, (coyoteW), (coyoteH));
    if (coyoteX!=5) {
        coyoteX-=5;
    }
    else if (coyoteX==5) {
        drawText();
    }
}

function drawText() {
    textSize(12);
    fill(15, 30, 110)
    text('the circle of life', 200, 20);
}


I was watching a show where a guy had a mouse in his apartment and to get rid of it, he brought in a snake. Then he realized he had a snake running loose, so he brought in a hawk. This inspired me to make this short animation showing a simple food chain. First there are some innocent berries which get eaten by a blister beetle which gets eaten by a quail which gets eaten by a coyote.

Looking Outward-10

https://reas.com/knbc/

For this LO, I chose to look at artist Casey Reas. Casey is the co-founder of Processing which is the grandfather to p5.js. I was really interested in seeing how the person who created Processing created art using a tool that they had imagined and built. The Sound Art piece I looked at is called KNBC. It was created in December 2015 using footage from news broadcasts from the year. This footage was manipulated in Processing to create a collage of pixels. What I love about this piece is how a video broadcast which was meant to tell a specific story was broken down by Casey into these collages and then combined with music to tell a whole new story. I also love that even though there is no clear clear picture or words, I still feel like I can understand the story that each scene is telling. Throughout the video of the piece playing, the transitions of music and color show you different parts of the story and you can tell when a scene has ended and another has begun.

shot of the piece during an installation
another shot of the piece during an installation

Looking Outward-08

https://ahprojects.com/

https://megapixels.cc/

https://vframe.io/

For this blog post I researched Adam Harvey.

Adam graduated from the Interactive Telecommunications Program at NYU in 2010. He also studied engineering and photojournalism at PSU. Currently, he is based in Berlin as a digital fellow at Weizenbaum Institut and a research fellow at Karlsruhe HfG. Adam’s work revolves around themes of privacy and surveillance technologies.

In Adam’s Eyeo talk, he walked us through two large projects: frame.io and megapixels.cc. In this talk, Adam broke down what facial recognition and facial detection mean and the deeply rooted flaws in these concepts. He repeatedly asked the question, “What is a face?” When breaking down this question, Adam said, “The face of today is not the face of tomorrow because the very word “face” is abstract, unstable, and inflationary.” There is no universal definition of what particular aspects define a “face” and because of this, facial detection technologies are vastly different and vastly inaccurate. Biometrics are not absolute yet technology is, so this creates a strong mismatch when it comes to these technologies.

Through walking us through megapixels, Adam shared different datasets of facial images that are being used by defense institutions for research. One dataset was of students at the University of Colorado Colorado Springs in which they specifically documented that they did not request permission nor inform students of their involvement in this project. Learning about these datasets made me increasingly more weary of my privacy than I already was.

A big part of Adam’s work is bringing transparency to the ways people are being surveilled and breaking down the technologies for how it’s done. This is something I strongly admire and appreciate. A presenting tactic that Adam used that I found quite successful was presenting all the facts in a strictly formal way and then letting the viewers come to their own conclusion about what it all meant. I think we all came to the same conclusion, but by doing this instead of him explaining what his conclusion was, the conclusion felt genuine and accurate. I also appreciated how he asked questions throughout the presentation. This forced me to stop and think and really be involved in what he was talking about.

I was interested in this lecture because of the rise in talk about facial recognition and spoofing these technologies related to the BLM protests that have been ongoing for the past several months. I had actually heard about Adam’s project CV Dazzle on twitter a few months ago to help protestors avoid being recognized and eventually going to jail. This project was about adding specific shapes and elements to your face to spoof the technology.

I’m curious to see how these technologies evolve and how we can increase people’s privacy. I understand the desire for technological advancement, but at what cost.

Project 07-Curves

project07-curves
/*
Lauren Kenny
lkenny@andrew.cmu.edu
Section A

This program draws a grid of Epicycloids.
Functions for this shape where adapted from 
https://mathworld.wolfram.com/Epicycloid.html.

*/


//sets up the canvas size and initial background
function setup() {
    createCanvas(480, 480);
    background(220, 100, 100); 
}

//draws a grid of epicycloids
function draw() {
    translate(20, 20);
    background(0);
    strokeWeight(2);
    noFill();

    //color changes with mouse position
    //red and green change with y position
    //blue changes with x position
    var r=map(mouseY, 0, height, 80, 255);
    var g=map(mouseY, 0, height, 80, 120);
    var b=map(mouseX, 0, width, 80, 200);
    
    for (var row=0; row<width-20; row+=50) {
        push();
        for (var col=0; col<height-20; col+=50) {
            stroke(r, g, b);
            drawEpicycloid();
            translate(0, 50);
        }
        pop();
        translate(50, 0)
    }
}

//draws a singular epicycloid
function drawEpicycloid() {
    var minPetal=6;
    var maxPetal=10;
    var minSize=4;
    var maxSize=8;
    //number of petals increases as y position of mouse increases
    var numPetals = int(map(mouseY, 0, height, minPetal, maxPetal));
    //size of shape increases as x position of mouse increases
    var size = (map(mouseX, 0, width, minSize, maxSize))/(numPetals/2);

    beginShape();
    for (var i=0; i<100; i++) {
        var t = map(i, 0, 100, 0, TWO_PI);
        var x = (size * (numPetals*cos(t) - cos(numPetals*t)));
        var y = (size * (numPetals*sin(t) - sin(numPetals*t)));
        vertex(x, y);
    }

    endShape();
}

For this project I was really interested in the epicycloid because of the variation that could be added to the number of petals. In my program, I explored altering the number of petals in relation the mouse y position. I also added a variation in the size based on the mouse x position. It was fun to figure out through experimenting what each variable in the formula affected within the actual shape. Here are some screen shots with different mouse positions.

Looking Outwards-07

http://intuitionanalytics.com/other/knowledgeDatabase/

http://moebio.com/research/sevensets/

This project titled “Personal Knowledge Database” was created by Santiago Ortiz. In this computational project, Santiago catalogues his internet references collected over more than 10 years. These references include projects, wikipedia articles, images, videos, texts, and many others. All of these references are organized into an isomorphic 7 set Venn diagram that tries balance each section. The 7 categories in this Venn diagram are humanism, technology, language, science, interface, art, and networks. He has also included 19 filters based on the source of the reference (ie. Image, post, blog, book, etc.).

What I absolutely love about this project is the self-reflection of his own digital searches and references. I think looking at 10 years of this data can teach you a lot about yourself, and I’ve always admired large scale self-reflection. What is also amazing about this project, is that all of these references are embedded into the interface, so with one click you can access any of the information. This project shows a lot about this artist’s sensibilities, and I admire them very much. I would be curious to know how Santiago feels after cataloguing this much personal data and finding patterns.

One other comment I have about this work is that I find it a bit hard to keep track of the category overlaps with the main Venn diagram. With the colored archetype, you are given a list of which colors are overlapping with each section you hover over. I wonder if this would be a helpful section to be utilized in the main project.

Project 06-Abstract Clock

project-06-abstractClock
/*
Lauren Kenny
lkenny@andrew.cmu.edu
Section A
Project-06

This program draws an abstract clock that changes over time.

*/

function setup() {
    createCanvas(480, 100);
    noStroke();
}

function draw() {
    var c=255-(hour()*10.5);
    background(c);
    var s=second();
    var m=minute();
    var h=hour();
    var mx=10;
    var sx=11;
    var hx=10;

    //draws the hours
    for (H=0; H<h; H++) {
        var y=10;
        var width=15;
        var height=50;
        var dx=18;
        fill(230, 180, 170);
        rect(hx, y, width, height);
        hx+=dx;
    }

    //draws the minutes
    for (M=0; M<m; M++) {
        var y=65;
        var width=2;
        var height=25;
        var dx=8;
        fill(250,120,120);
        rect(mx, y, width, height);
        mx+=dx;
    }

    //draws the seconds
    for (S=0; S<s; S++) {
        var y=95;
        var width=2;
        var dx=8;
        if (c>150) {
            fill(0);
        }
        else {
            fill(255);
        }
        circle(sx, y, width);
        sx+=dx;
    }  
}

For this project, I wanted to create a clock that visually showed the number of hours, minutes, and seconds. I chose to have this be a 24 hour clock as opposed to 12 hours because 12 hour clocks make no sense. To do this, I created for loops that presented n number of objects based on the number of hours/minutes/seconds. I decided that hours were most important and then minutes and then seconds so I created visual size differences to reflect that logic. Also, I wanted there to be some reflection of the natural world, so I have the background getting gradually darker with each passing hour. I found the hour(), minute(), and second() built-ins to be quite confusing, but it is quite exciting to see them actually working.

Looking Outwards-06

I have been quite interested in random generators and found this random art generator.

http://www.random-art.org/

This program was created by Andrej Bauer in ocaml. The website contains a web version using ocamljs. To run the program, you are able to input a title for your piece. Based on the documentation, works are normally composed of two words. The words trigger a formula that randomly generates pseudo-random numbers which then create the picture. It is pseudo-random because the same word will always trigger the same number output and create the same artwork. Within the two word name, the first name determines the colors and layout of focal point. The second word determines the arrangement of the pixels in the image. When I first tested this out, I only typed in one word so I wonder how the program works if only given one input.

I admire this project because of the connections created between words, art, and randomness. It is wonderful seeing all of the art generators out there pushing the limits of the meaning of art and creativity. I find the parameters chosen for the two inputs to be interesting, and I wonder what it might look like if different parameters of the piece were explored.

This project is also quite exciting because of the large number of possibilities it can create. I don’t know how many combinations of two words there are, but I’m sure there are a lot. This website allows you to make your own image and then submit it to a library for people to vote on their favorites. It would be interesting to what words are used to make the best pictures using this algorithm.