Final Project – Simple Virus Simulator

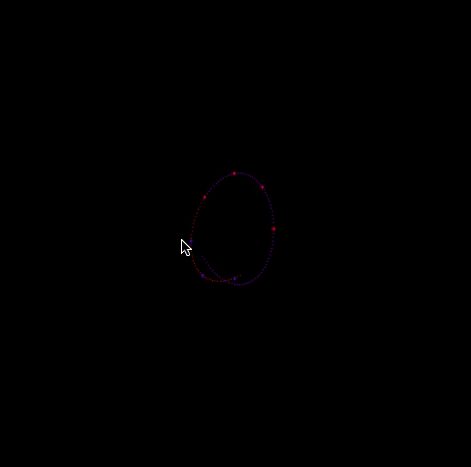
For my final project, I wanted to create a simple virus simulation where one infected particle infects a population of healthy particles. The particles move across the canvas at random speeds and directions and bounce off the edges of the canvas. I wanted to show how quickly disease can spread within a population if you don’t take preventative measures such as wearing a mask and social distancing.

  1. Your mouse is a social distancing particle that repels all other particles that comes within its’ social distancing radius.
  2. Healthy particles that come within range of a sick particles’ “infection radius” will be infected.
  3. If you press any key on the keyboard, more healthy particles will be added to the screen (but will quickly be infected by the population of sick particles).
  4. If you click the “RETURN” key, the sick particles will all reset to healthy and the process of infection begins again. 
  5. In the upper left corner, there is a counter for the number of sick particles.
Covid Simulation
//Maggie Ma
//Section D
//Final Project Virus Simulator

var dots = [];
var infectionRadius = 20; //light red infection radius 
var rpc = 19000; //repelling constant


function setup() {

    createCanvas(600, 600);
 	for (i = 0; i < 100; i++) { //create 100 healthy dots
		var p = new dot();
		dots.push(p);
	}
	frameRate(20);
}

function draw() {
	background(255);

	for (var i = 0; i< dots.length; i++) { //draw uninfected dots
		dots[i].update();
		dots[i].show();
	}
	if (frameCount ==100){
		dots[9].infected = true; //after 100 frameCount, one dot becomes sick
	}
	//dots infect eachother if come in contact in the "infectionRadius"
	for (var m = 0; m<dots.length; m++) {
		for (var i = 0; i < dots.length; i++) {
			if (dist(dots[m].x, dots[m].y,
		dots[i].x, dots[i].y) <= infectionRadius) {
				if (dots[m].infected == true) {
						dots[i].infected = true;
			}
		}
		}
	}
	//Social Distance dot that repels all infected dots
	ellipseMode(CENTER);
	noStroke();
	fill(0,0,0,100);
	ellipse(mouseX,mouseY,100,100);
	fill(0);
	ellipse(mouseX,mouseY,25,25);

	var sickcounter = 0;
	//var healthycounter = 100;

	for (var i = 0; i < dots.length; i ++) {
		if(dots[i].infected ==true) {
			sickcounter++;
			//healthycounter--;
		}
	}
	noStroke();
	fill(200);
	textSize(12);
	text("You are the social distancing particle.", 10, 25);
	text("Press any key to add healthy particles.", 10, 50);
	fill(200);
	text("Press 'Return' key to reset.", 10, 75);
	text("Sick Particles:", 10,100);
	text(sickcounter, 130,100);

	
}

//add new uninfected dots by pressing key
function keyPressed() {
	dots.push(new dot(mouseX, mouseY));
	//healthycounter++;

	//if click "Return key" simulation resets.
	if (keyCode === RETURN) {
		for (var m = 0; m<dots.length; m++) {
			for (var i = 0; i < dots.length; i++) {
				if(dots[i].infected == true) {
					dots[i].infected = false;
					dots[9].infected = true;
					sickcounter = 0;
			}
		}
		}
	}
}

class dot { 

	constructor() { 
		this.x =random(3.5, width-3.5);
		this.y =random(3.5,height-3.5);
		this.dx =random(-10,7);
		this.dy =random(-10,7);
		this.infected = false
		this.history = [];
	}

	update() { 
		//move black dots
		this.x+= this.dx; 
		this.y+=this.dy;

		//bounce off the edges of the canvas
		if (this.x > width) { //bounce off right wall
			this.x = width - (this.x - width);
			this.dx = -this.dx
		} else if (this.x < 0) { //bounce off left wall
			this.x = -this.x;
			this.dx = -this.dx
		}
		if (this.y > height) { // bounce off bottom
       		this.y = height - (this.y - height);
        	this.dy = -this.dy; 
    	} else if (this.y < 0) { // bounce off top
        	this.y = -this.y;
        	this.dy = -this.dy;
		}

		//create the particle trail
		var v = createVector(this.x, this.y);
		this.history.push(v);
		if (this.history.length>15) { //trail is 15 ellipses long
			this.history.splice(0,1); //splice out the trail circle at index 0
		}

		//effect of the social distancing repeller
		var dp = dist(this.x, this.y, mouseX, mouseY);
    	var f = rpc /(Math.pow(dp, 2)); //Math.pow is exponent w/ base dp
    	var dirx = (this.x - mouseX)/dp;
   		var diry = (this.y - mouseY)/dp;
    	this.x += f*dirx;
    	this.y += f*diry;
	}	

	show() { 
		//if dot is infected, color red
		if (this.infected ==true) {
			noStroke();

			//creating dot "tail"
			for (var i = 0; i < this.history.length; i++) {
				var pos = this.history[i];
				fill('red');
				ellipse(pos.x,pos.y, i*.15, i*.15) 
			}
			//drawing red dot
			fill(255,0,0,100);
			ellipse(this.x, this.y, 30,30);
			fill('red');
			ellipse(this.x,this.y,10,10);

		//else if dot is uninfected, color black dot
		} else {
			noStroke();
			//creating dot "tail"
			for (var i = 0; i < this.history.length; i++) {
				var pos = this.history[i];
				fill(0);
				ellipse(pos.x,pos.y, i*.15, i*.15) 
			}
			fill(0);
			ellipse(this.x,this.y, 10,10); 
		}
	}
}

Project 11 – Generative Landscape

My project is a simple landscape with hills, trees, buildings, birds, and the sun. The trees vary in size and location, the building varies in width, and the birds vary in location and speed.

Maggie – Generative Landscape
//Maggie Ma
//Section D
//Generative Landscape

var buildings = [];
var hills = [];
var noiseParam = 0;
var noiseStep = 0.02;
var trees = [];
var birds = [];


function setup() {
    createCanvas(400, 500); 
    strokeWeight(4);
    
    // create an initial collection of buildings
    for (var i = 0; i < 2; i++){
        var rx = random(width);
        buildings[i] = makeBuilding(rx);
    }
    //create an initial collection of birds
    for (var i = 0; i < 3; i++){
        var rx = random(width);
        birds[i] = makeBird(rx);
    }

    // drawing hills in the back
    for (var i = 0; i<width/5 +1; i++) {
    	var n = noise(noiseParam);
    	var value = map(n,0,1,0,height+50);
    	hills.push(value);
    	noiseParam+=noiseStep;
    }
    frameRate(15);
}


function draw() {
    background(255,203,186); //light pink

    //sun
    fill(253,165,0); //yellow
    circle(width/2, height/2-70, 120.438 );

    //birds
    updateandDisplayBird();
    removeBirdThatHaveSlippedOutOfView();
    addNewBirdWithSomeRandomProbability();	

    //hills
    drawHills();
    displayHorizon();

    //building
    updateAndDisplayBuilding();
    removeBuildingsThatHaveSlippedOutOfView();
    addNewBuildingsWithSomeRandomProbability(); 

   //trees
    updateAndDisplayTrees();
    removeTreesThatHaveSlippedOutOfView();
    addNewTreesWithSomeRandomProbability(); 
}

function drawHills() {
	hills.shift();
    var n = noise(noiseParam);
    var value = map(n,0,1,0,height+50);
    hills.push(value);
    noiseParam += noiseStep;

    beginShape();
    vertex(0,height);
    for(var i =0; i <= width/5; i++) {
    	fill(255,163,130); //pink color
    	strokeWeight(4);
    	vertex((i*5),hills[i]);
    
    }
    vertex(width,height);
    endShape();
}

//creating trees
function makeTree(birthLocationX) {
    var t = {x: birthLocationX,
                breadth: round(random(10,30)),
                speed: -5.0,
                y: random(10, 40), //randomize tree size and location
                w: random(30, 40),
                h: random(40, 60),
                move: treeMove,
                display: treeDisplay}
    return t;
}

function treeMove() {
    this.x += this.speed;
}

function treeDisplay() {
    push();
    translate(this.x, height -125);
    strokeWeight(4); 
    fill(80,202,119);
    //leaves
  	ellipse(this.x,this.y, this.w, this.h);
  	//trunk
  	line(this.x, this.y+10, this.x, this.y+70);
    pop();
}

function updateAndDisplayTrees(){
    for (var i = 0; i < trees.length; i++){
        trees[i].move();
        trees[i].display();
    }
}

function removeTreesThatHaveSlippedOutOfView(){
    var treesToKeep = [];
    for (var i = 0; i < trees.length; i++){
        if (trees[i].x + trees[i].breadth > 0) {
            treesToKeep.push(trees[i]);
        }
    }
    trees = treesToKeep;
}
function addNewTreesWithSomeRandomProbability() {
    var newTreeLikelihood = 0.07; 
    if (random(0,1) < newTreeLikelihood) {
        trees.push(makeTree(width));
    }
}

//creating building
function makeBuilding(birthLocationX) {
    var bldg = {x: birthLocationX,
                breadth: 70,
                speed: -8.0,
                w: random(70,110), //randomize width
                move: buildingMove,
                display: buildingDisplay}
    return bldg;
}

function buildingMove() {
    this.x += this.speed;
}

function buildingDisplay() {
	push();
    strokeWeight(4); 
    fill(253,165,0); //yellow block on right side
  	rect(this.x ,315.478 ,this.w ,137.574);
  
  	rect(this.x - 55.901, 364.514 ,15.016 ,88.538); //yellow pillars
  	rect(this.x +7.51, 364.514 ,15.016 ,88.538);
  	rect(this.x-28.083,180.775,23.237,26.131); //yellow top
  	fill(255,255,255);
  	rect(this.x-33.153,206.996,33.377,33.377); //middle section
  	fill(253,165,0);
  	rect(this.x-21.845,219.566,10.762,20.807);
  	fill(255,255,255);
  	rect(this.x-40.661, 240.463,48.108 ,212.59 ); //bottom base
  	fill(0,195,227);
  	rect(this.x-40.661,259.105,15.016 ,25.094); //turquoise designs
  	rect(this.x-40.661,302.931,15.016 ,25.094);
  	rect(this.x-7.508,259.105,15.016 ,25.094 );
  	rect(this.x-7.508, 302.931,15.016 ,25.094);
  	fill(225,43,0);
  	rect(this.x-40.885,346.758,15.016,106.295); //red designs
  	rect(this.x-7.508,346.758,15.016,106.295);
  	line(this.x-25.869,240.8 ,this.x-25.869,453.053);
  	line(this.x-7.508,240.8 ,this.x-7.508,453.053);

    pop();
}

function updateAndDisplayBuilding(){
    for (var i = 0; i < buildings.length; i++){
        buildings[i].move();
        buildings[i].display();
    }
}

function removeBuildingsThatHaveSlippedOutOfView(){
    var buildingToKeep = [];
    for (var i = 0; i < buildings.length; i++){
        if (buildings[i].x + buildings[i].breadth > 0) {
            buildingToKeep.push(buildings[i]);
        }
    }
    buildings = buildingToKeep;
}
function addNewBuildingsWithSomeRandomProbability() {
    var newBuildingLikelihood = 0.015; 
    if (random(0,1) < newBuildingLikelihood) {
        buildings.push(makeBuilding(width));
    }
}

//creating birds
function updateandDisplayBird(){
    for (var i = 0; i < birds.length; i ++){
        birds[i].move();
        birds[i].display();
    }
}

function removeBirdThatHaveSlippedOutOfView(){
    var keepBirds=[];
    for (var i = 0; i < birds.length; i++) {
        if (birds[i].x < width) {
            keepBirds.push(birds[i]);
        }
    }
    birds = keepBirds;
}

function addNewBirdWithSomeRandomProbability(){
    var newBirdLikelihood = 0.01; 
    if (random(0,1) < newBirdLikelihood) {
        birds.push(makeBird(15, 15));
    }
}

function Birdmove(){
    this.x += this.speed;
}

function birdDisplay(){
    fill(0);
    stroke(0);
    push();
    translate(this.x, this.y);
    //wings
    triangle(0, 0, 3, 0, -2, -3);
    triangle(0, 0, 3, 0, 2, 3);
    pop();
}

function makeBird(birthLocationX, birthLocationY){
    var bird = {x: birthLocationX,
                y:random(100,200),
                speed:random(2, 9),
                move: Birdmove,
                display: birdDisplay};
    return bird;
}
//creating grass horizon line
function displayHorizon(){
    fill(106,207,124);
    stroke(4);
    rect(0, height-50, width, height-50);
}

LO 11 – A Focus on Women Practitioners

Claudia Hart

The Dolls House (2016)

For my female artist I chose to learn about Claudia Hart, a computational fine artist of interactive imagery. Her work features topics such as issues of the body, perception, the real vs. unreal, and the relationship between nature and technology. Hart’s work is “symbolist and poetic” (from her website bio), and can be described as mesmerizing and hypnotic. She describes her work as “post photography” —her pieces are generated from computer models instead of captured with a camera. 

I examined her piece The Dolls House—a special series of video, drawing and sculpture inspired by the media ballet The Dolls, based in the philosophical idea that history forever renews itself through “a process of decadence, decay and rebirth” (https://claudiahart.com/The-Dolls-House-2016). In this piece, Hart molded mathematical cycles into visual form: a figurative flicker film created with rhythmic animations and pulsing patterns. The passage of time is defined by a cyclical animation where a light moves around the virtual set, casting shadows to mimic sunrise and sunset. 

Project 10 – Sonic Story

My story is a little western horse racing film. In the first scene, the gun goes off. Then the horses start galloping as the crowd cheers.

Sonic Story – Maggie
//Maggie Ma
//Section D
//Sonic Story

//STORYLINE: a little western horseracing film. 
//In the first scene, the start gun goes off.
//Then, the horses start galloping.
//Finally, the crowd cheers.

var horseImage = [];   // an array to store the images
var horse = []; //array to hold horse

//frame counter 
var frameCount = 0;

//crowd image
var crowd;

//gun image
var gun;

//race gun x position
var gunX = -200;

//horse background of first scene
var horsebg; 

//crowd scene zoom in and out
var zoomx = 0; 
var zoomy = 0;

//sounds
var neigh;
var shot;
var gallop;
var crowdcheer;

function preload(){

    neigh = loadSound("https://courses.ideate.cmu.edu/15-104/f2020/wp-content/uploads/2020/11/neigh.wav");
    shot = loadSound("https://courses.ideate.cmu.edu/15-104/f2020/wp-content/uploads/2020/11/gunshot-1.wav");
    gallop = loadSound("https://courses.ideate.cmu.edu/15-104/f2020/wp-content/uploads/2020/11/gallop-1.wav");
    crowdcheer = loadSound("https://courses.ideate.cmu.edu/15-104/f2020/wp-content/uploads/2020/11/crowd.wav");
    
    //horse running image files
    var filenames = [];
    filenames[11] = "https://i.imgur.com/Kpc8OBb.gif";
    filenames[10] = "https://i.imgur.com/G6TaUvT.gifg";
    filenames[9] = "https://i.imgur.com/lbhzzYr.gif";
    filenames[8] = "https://i.imgur.com/wuAUUaw.gif";
    filenames[7] = "https://i.imgur.com/083HFuW.gif";
    filenames[6] = "https://i.imgur.com/VpQvDCP.gif";
    filenames[5] = "https://i.imgur.com/4G68Ubf.gif";
    filenames[4] = "https://i.imgur.com/hE8DQXc.gif";
    filenames[3] = "https://i.imgur.com/6WcJ0gS.gif";
    filenames[2] = "https://i.imgur.com/T1Xwkkj.gif";
    filenames[1] = "https://i.imgur.com/2PDeXWh.gif";
    filenames[0] = "https://i.imgur.com/shnBbse.gif";

    crowd = loadImage('https://i.imgur.com/9tu2YoL.jpg');
    gun = loadImage('https://i.imgur.com/lmEa4Kh.png');
    horsebg = loadImage('https://i.imgur.com/Q9r6TGv.png');

 
    for (var i = 0; i < filenames.length; i++) {
        horseImage[i] = loadImage(filenames[i]);
    }
}

function stepCharacter() { //update function
    this.imageNumber+=1;

    //reset image cycle when reach the end of array
    if (this.imageNumber>11) {
        this.imageNumber =0; 
    }
}

function drawCharacter() {
    //making the dude walk
    image(horseImage[this.imageNumber], this.x, this.y);
}

function makeCharacter(wx, wy, wdx, wdy) { //character constructer
    w = {
        x: wx,
        y: wy, 
        dx: wdx,
        dy: wdy, 
        imageNumber: 0,
        stepFunction: stepCharacter,
        drawFunction: drawCharacter
        }
    return w;
}

function setup() {
    createCanvas(480, 350);
    useSound();
    imageMode(CENTER);
    for (var i=0; i<1; i++) { 
        var w = makeCharacter(240,170,0,0);
        horse.push(w); 
    }
    frameRate(10);
}

function soundSetup () {
    neigh.setVolume(0.8);
    shot.setVolume(0.5);
}
function draw() {
    background(255);

    frameCount++;
    if (frameCount >= 0& frameCount < 160) { //race gun goes off scene
        image(horsebg, 240, 196, width, height); //background
        image(gun, 200 + gunX, height-250, width, height); //gun image
        if (frameCount >= 0 & frameCount < 70){ 
            gunX += 7; //gun slides in
        } else if (frameCount >= 90 & frameCount <160) {
            gunX -=12; //gun slides out
        } 
    }
   
    else if (frameCount >=100 & frameCount <300) { //horse galloping scene
        for (var i=0; i<1; i++) { //three people walking
            var w = horse[i];
            push();
            w.stepFunction();
            w.drawFunction();
            pop();
        }

    } else if (frameCount >=300 & frameCount < 400) { //crowd cheering scene
        image(crowd, 240, 196, width + zoomx, height + zoomy);
        zoomx +=3; //zoom in x
        zoomy += 3; //zoom in y 

    } else if (frameCount >= 400 & frameCount <450) { //end scene
        background(0);
        fill(255);
        textFont('Courier New Italic')
        textSize(16);
        text('the great race.', width-200, height-75);
    
    }else if (frameCount >= 450) {
        background(0);
        noLoop();
    }

    //sound play
    if (frameCount == 88) {
        shot.play();
    } else if (frameCount == 130){
        gallop.play();
    } else if (frameCount == 200){
        neigh.play();
    } else if (frameCount == 270) {
        crowdcheer.play();
    } else if (frameCount > 400) {
        crowdcheer.stop();
    }
}   

LO – 10 Computational Music

Endel by Oleg Stavitsky

Endel (CEO and co-founder Oleg Stavitsky) is a generative music app that creates sound based on the user’s environment. The app pulls data from the user’s phone including the weather, heart rate, physical activity rate, GPS location, and circadian rhythms to create personalized soundscapes (ex. Gentle music for sleeping, studying, and relaxing) by adjusting the sonic output to match user activity. It can siphon heart-rate from your smartwatch and create a beat to match your pulse and footsteps. I think this app is extremely powerful in that it has been used to aid in ADHD, insomnia, and tinnitus by curating relaxing and peaceful personalized music. It never creates two compositions that sound the same—I almost want to download it and try the app out myself!

Review: Endel – an app for fine-tuning your mind - TapSmart
Endel App - Personalized sounds | UI Sources

LO 09 – On Looking Outwards

All Streets Limited (2007) by Ben Fry

In Bon’s Looking Outwards on Data Visualization, he examined All Streets Limited by Ben Fry. Fry used data from the U.S. Census Bureau to code the map in Javascript, which consists of 240 million individual road segments across the United States. He applied the Albers equal-area conic projection to obtain the longitude and latitude coordinates of the streets. I agree with Bon that the illustration provides a macro view of our national interconnectedness. After doing my own research, I also found it interesting that the map contains no other terrain (canyons, rivers, mountains, etc.), yet we can still see the shapes of these natural forms emerge as roads weave and navigate around, demonstrating the power dynamics between the natural and artificial/industrial. 

Ben Fry’s All Streets Limited.
Closeup of the roadless terrain that forms the Appalachian Mountains.

Project 09 – Portrait of my Brother

For my portrait I chose to draw my little brother. I had him choose his favorite images from a set of keyboard symbols. The random symbols increase in size as the mouse moves to the right. Symbols also draw along with mouse movement. If you click the mouse, the canvas wipes white and resets.

Maggie – Portrait
//Maggie Ma
//Section D
//Self-Portrait

let img;
let symbols=["☻","☺","♬","☾","⍣","㋡","☀","♟"]; //array of symbols

function preload() {
  img = loadImage('https://i.imgur.com/M8aUttC.jpg'); 

}

function setup() {
  createCanvas(400, 533);
  background(255);
  img.loadPixels();
  noStroke();
}

function draw() {
  let x = floor(random(img.width)); //x position of symbols
  let y = floor(random(img.height)); //y position of symbols
  let pixels = img.get(x, y); //grab pixels from image

  //randomly select symbols from array
  var r = int(random(0,9));
  var randompicker = symbols[r]; 


  fill(pixels); //fill symbol with proper pixel color
  //prevent symbols from getting too large
  //symbols increase in size as mouse moves to right
  textSize(mouseX/20); 
  text(randompicker, x,y);

  //draw symbols as mouse moves
  textSize(10);
  text(randompicker, mouseX, mouseY);

  //refresh to white canvas when mouse is pressed
  if (mouseIsPressed) {
  	background(255);
  }
}
Beginning of Rendering.
Middle of Rendering.
Near-completed Render.
Original of my adorable brother.

LO 08 – The Creative Practice of an Individual

Sarah Groff Hennigh-Palermo

Sarah Groff Hennigh- Palermo is an artist, programmer, and data designer who explores the relationship between technology and information by creating work focused on an “aesthetic exploration of experience” (Hennigh-Palermo) rather than an information-instrumental output of data. Her talk centered on undermining computers—how can make computers less “machine-like” and more accessible, visceral, and contextual? Her piece Oublié/trouvé, or: Towards a Theory of Invested Objects is an app and product that visualizes data based on your feelings and experiences (temperature, proximity from home, humidity, weather, etc) at a specific moment or location as an attempt to implement the personal into the machine. She then developed LiveCode, a communal computing experience of visuals, music, dance, and games with code written and evaluated in real time. She is also a part of an algorithmic band called Codie, which codes live music and visuals at each performance, which I thought was pretty cool. 

A workshop of live coding visuals.

Project 07 – Curves

I chose to use the Epitrochoid Curve for my project this week. My code draws two curves—a blue and red one, and it’s pretty cool to see how and where they overlap with each other.

*because of the lag it’s really slow on WordPress ;(*

  • Refresh the page to start from center with white background.
  • Move the mouse back and forth to build contrast areas by changing the direction of the curve (inward or outward).
  • Control the speed of curve drawn with mouse position.
  • Click the mouse to change background to black.
  • Click and hold the mouse to erase all previous curve paths, and visualize the curve with stars that get brighter and dimmer with mouse position (brightest at lower right corner).
  • Release the mouse to draw the curve at various starting points.
Maggie – Curves
//Maggie Ma
//Section D

//variables for equation on https://mathworld.wolfram.com/Epitrochoid.html
var a = 30; //radius of small circle
var b = 10; //radius of rotating perimeter circle
var h = 0; //height of curve from the center of b
var t; //time
var x;
var y;
var speed; 


function setup() {
    createCanvas(500,500);
    background(255);
}

function draw() {
    noStroke();

	constrain(mouseX,0,width);
	constrain(mouseY, 0, height);

	//draws dots (without trail) when mouse is pressed
	//background changes to black
	//dots change in size with mouse position
    if (mouseIsPressed) { 
		background(0);
		for (t = 0; t <TWO_PI; t += 1) {
			fill(0,0,255);
	    	epCurve2(); }

   		for (t= 0; t<PI; t+= 1) {
   			fill(255,0,0);
	    	epCurve2(); }
	}

	speed=map(mouseX,0,width,.5,-.5); //changes the speed and size of curve as mouseX moves
    a+=speed; 
    h+=speed;
  	
  	fill(255,0,0); //drawing red curve
    for (t =-PI; t < TWO_PI; t += .08) {
    	epCurve();
    }

    fill(0,0,255); //drawing blue curve
    for (t= -PI; t<PI; t+= .08) {
	    epCurve();
    }
}

function epCurve() { //Epitrochoid Curve function
	push();
    translate(width/2, height/2); 
    //draw curve
    x=(a+b)*cos(t)-h*cos(((a+b)/b)*t); 
    y=(a+b)*sin(t)-h*sin(((a+b)/b)*t);
    ellipse(x,y,0.8,0.8); //draws dots on canvas
    pop();
}

function epCurve2() { //Dotted curve when mouse is pressed
	push();
   	translate(width/2, height/2); 
    //draw curve
    x=(a+b)*cos(t)-h*cos(((a+b)/b)*t); 
    y=(a+b)*sin(t)-h*sin(((a+b)/b)*t);
    ellipse(x,y,0.5+mouseX/100,0.5+mouseY/100); //draws dots on canvas that change size w/ mouse position
    pop(); 
}

LO 07 – Data Visualization

Wind Map (2012 – present)

Martin Wattenberg and Fernanda Viegas 

Wattenberg and Viegas’ Wind Map.

Martin Wattenberg and Fernanda Viegas’ Wind Map visualizes the tracery of wind flow over the United States in the most basic and familiar way—visual motion. On calm wind days, the artwork can be a “soothing meditation on the environment” (Wattenberg), whereas during hurricanes, the piece can become overwhelming and terrifying. Something that I found interesting was that bird watchers actually use the map to track migration patterns, and cyclists use it to prepare for trips. Even conspiracy theorists use the map to track mysterious air chemicals. Data for the wind map was collected from the National Digital Forecast Database, and Wattenberg took inspiration from Edmund Halley (1686), who developed the technique of using comet-like trails to visualize motion. Wattenberg used HTML and JavaScript. 

Images of the Wind Map during Hurricane Isaac (September 2012).