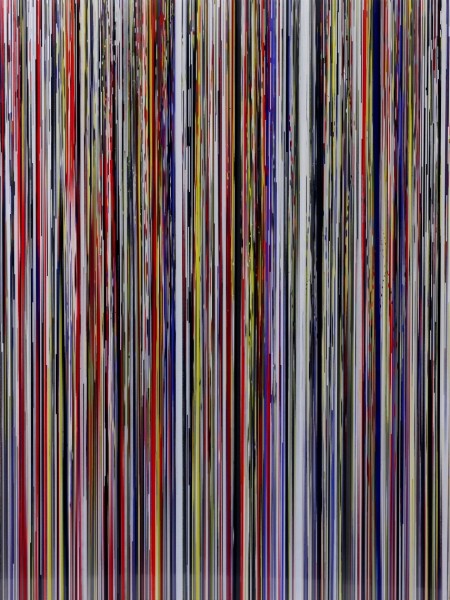
The artist Pascal Dombis uses digital tools and computer generation to explore the complexities of visual paradoxes. Many of his art appears like a glitch on the computer, although it has been carefully crafted through algorithmic elements that produce a controlled chaotic randomness. This is the paradox that Dombis is attempting to create in his artwork, which is that while the computer code and technology is very much controlled by the user, the resulting artwork it produces becomes something completely random and out of our imagination. This paradox in his artwork creates a feeling of unease and the loss of structure that we often find comfort in through technology. I admire his artworks because it inspires me to think deeper about the relationship we have with the control of technology.
Author: tian
Project 06-Abstract-Clock
var x = 0;
var y = 0;
var sDiam;
function setup() {
createCanvas(600, 600);
}
function draw() {
var s = second();
var m = minute();
var h = hour();
background(0, 0, h*10); //gets lighter by the hour
translate(width/2, height/2);
minuteRing(s, m);
secondRing(s, m, sDiam);
}
function minuteRing(s, m) { //big circle that appears within a minute
noStroke();
fill(148, 96, 139, s*4.25); //opacity increases with second
circle(x, y, 10*m); //diameter increases with minute
}
function secondRing(s, m, sDiam) { //the ticking clock that moves every second
fill(148, 96, 139);
rotate(radians(s*6)); //rotate every second by 6 degrees
var sDiam = (PI*10*m)/60; //diameter is circumference divided by 60 secs
circle(x+(10*m/2), y, sDiam);
triangle(x, y, x+(10*m/2), y-(sDiam/2), x+(10*m/2), y+(sDiam/2));
}
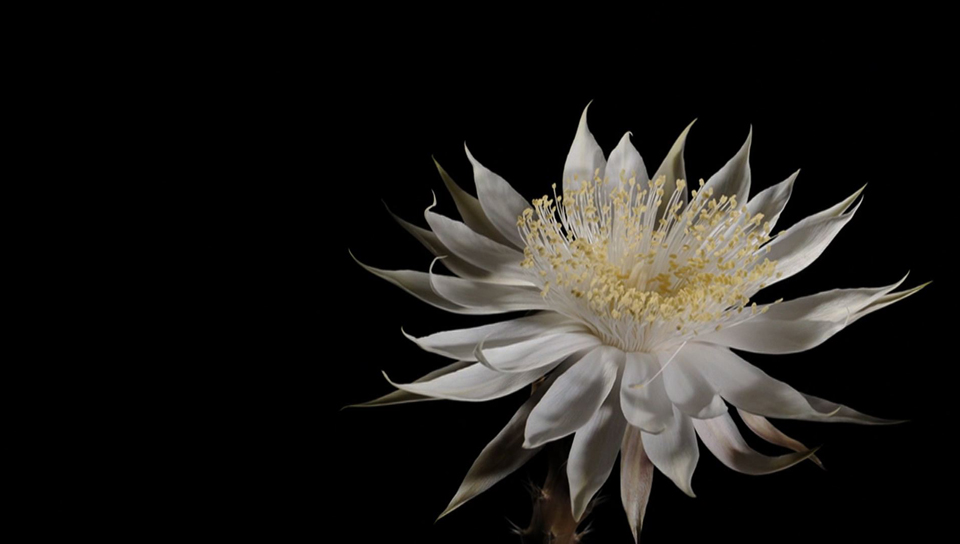
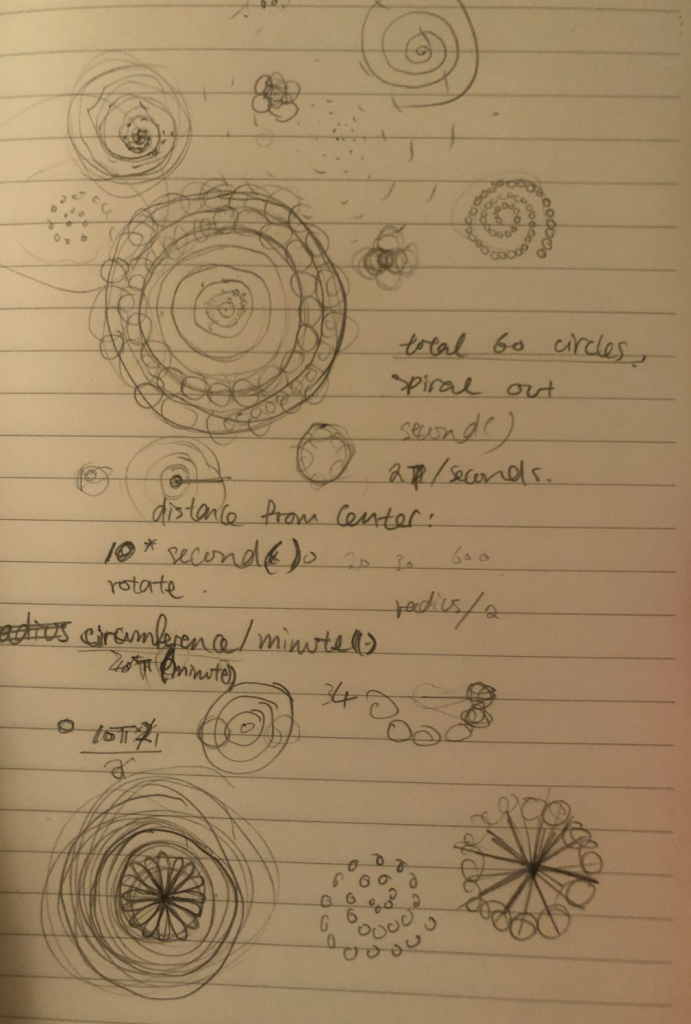
For this project I struggled a bit because I didn’t have enough time to create what I had visualized. I was inspired by the flower that blooms at night and wanted to create an image where the pedals grow bigger and bigger as time goes on.
I was only able to get the one pedal moving instead of having the whole flower in the background but basically the circle reveals itself to full opacity every minute as the pedal rotates, then the ring diameter increases with the minute. The background blue becomes lighter by the hour to signify sky.
Project 5: Wallpaper
var leafSize = 40;
function setup() {
createCanvas(400, 400);
background(220);
text("p5.js vers 0.9.0 test.", 10, 15);
}
function draw() {
background(111, 59, 72)
for (var x = 20; x <= 400; x += 50) {
for (var y = 20; y <= 400; y += 100) {
push();
leaf(x, y);
pop();
}
}
for (var x = 40; x <= 400; x += 50) {
for (var y = 80; y <= 400; y += 100) {
push();
secondLeaf(x, y);
pop();
}
}
noLoop();
}
function leaf(x, y) {
//decoration
noStroke();
fill(167, 80, 55)
circle(x-5, y+7, leafSize-15);
noFill();
stroke(167, 80, 55);
arc(x, y, 50, 50, PI/4, 5*PI/4);
stroke(225);
//left half
arc(x, y, leafSize, leafSize, 2*PI/3, 4*PI/3, OPEN);
//right half
translate(-20, 0);
arc(x, y, leafSize, leafSize, 5*PI/3, PI/3, OPEN);
//stem
translate(10, 0);
triangle(x-2, y+30, x, y-5, x+2, y+30);
line(x-5, y-5, x, y);
line(x, y, x+5, y-5);
line(x-5, y+5, x, y+10);
line(x, y+10, x+5, y+5);
}
function secondLeaf(x, y) {
//decoration
noStroke();
fill(207, 106, 39)
circle(x, y-8, leafSize/2);
noFill();
stroke(207, 106, 39);
arc(x, y, 50, 50, 5*PI/4, PI/4);
stroke(225);
//left half
arc(x, y, leafSize/2, leafSize/2, 2*PI/3, 11*PI/6, OPEN);
arc(x-13, y-13, leafSize/2, leafSize/2, PI/6, 2*PI/3, OPEN);
//right half
arc(x-10, y, leafSize/2, leafSize/2, 7*PI/6, PI/3, OPEN);
arc(x+3, y-13, leafSize/2, leafSize/2, PI/3, 5*PI/6, OPEN);
//stem
translate(-5, 0);
line(x, y, x, y-20);
}
I got the inspiration for my wallpaper from the fall season and leaves floating in the air.
Looking Outwards-05
This is located in Seoul, Korea, where a large screen display of a building is made to look like water waves crashing and moving around inside. The display is extremely realistic, with the installation of audio as well as the feeling of the water that’s about to break the glass and flow out into the streets. The company who made this installation is d’strict, they are a digital media tech company that specializes in designing and making, and one of their goals is bringing new visual and spatial experiences to the world. The installation uses an effect called anamorphic illusion to convey the visual. I find the installation very impactful and creates an experience that is new to many people, showing what computer graphics are now able to do.
Project 04-String Art
var dx2;
var dy2;
var dy3;
var numLines = 30;
function setup() {
createCanvas(400, 300);
background(220);
text("p5.js vers 0.9.0 test.", 10, 15);
noStroke();
line(200, 50, 200, 250); //vertical guide line
line(100, 50, 300, 250); //diagonal guide line
dx2 = (200)/numLines;
dy2 = (200)/numLines;
dy3 = (300)/numLines;
}
function draw() {
background(0);
// outer ring
push();
translate(200, 150); //origin in the middle
for (let i = 1; i <= 200; i += 1) {
rotate(2); //rotating around the origin
stroke(184, 156, 46, 70)
line(-50, -130, 200, -150);
}
pop();
// the middle square
var x1 = 100;
var y1 = 250;
var x2 = 100;
var y2 = 50;
for (let i = 0; i <= numLines; i += 1) {
stroke(111, 162, 179, 150);
line(x1, y1, x2, y2);
line(x1+200, y1-200, x2, y2);
x2 += dx2;
y2 += dy2;
}
var x1 = 100;
var y1 = 150;
var x2 = 200;
var y2 = 50;
for (let i = 0; i <= numLines; i += 1) {
//biggest diamond
stroke(40, 77, 89);
line(x1-100, y1, x2, y2-100);
line(x1-100, y1, x2, y2+100);
line(x1+300, y1, x2, y2-100);
line(x1+300, y1, x2, y2+100);
//smallest diamond
stroke(111, 162, 179);
line(x1, y1, x2, y2);
line(x1+200, y1, x2, y2)
y2 += dy2;
}
noLoop();
}
This is my string art inspired by a diamond ring. I wanted the diamonds to look three-dimensional.
LO 04- Sound Art
This interactive sound art exhibition made in 2016 is created by Anders Lind, a Swedish composer. The exhibition is called LINES, which is connected to the floors, walls, and ceiling to create sensors that allow the audience to be able to make music with the movement of their hands along the walls. While no musical experiences are required, this project brings novelty and inspiration to those who are new to music, allowing them to interact with musical notes with their own bodies. I am inspired by the exhibition because LINES creates a unique form of musical instrument using computer interaction and programming.
LookingOutwards-03
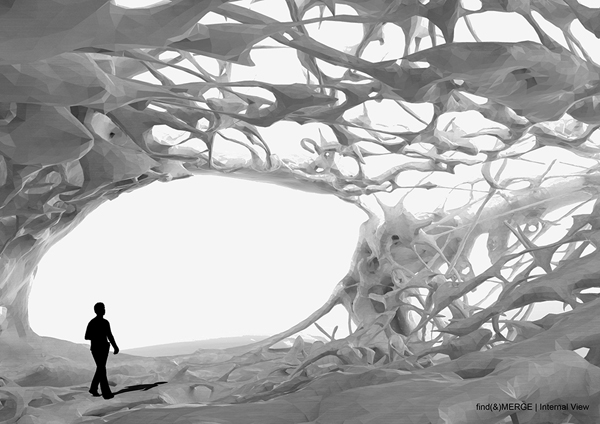
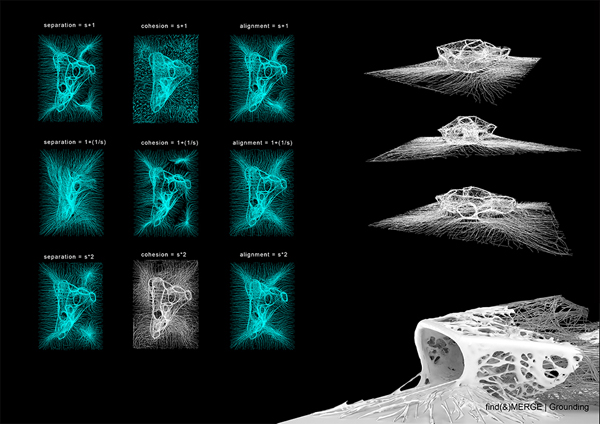
This project is called Find(&)MERGE made by SVEN, a group from the University of Bologna, Italy. The aim of this project is to design a place that represents an economic and cultural center. What I admire about it is that it attempts to computationally input the different behaviors and environmental elements into the construction of the project. The system created is supposed to grow and evolve depending on the self-organized interactions that affect the place. I think that it is important for architects to be able to take into consideration the ever-changing environments and behaviors and create architecture that can adapt that over long periods of time. This project recognizes this need in architectural design and is using computational fabrication to achieve the design.
Project 03: Dynamic Drawing
var angle = 0;
function setup() {
createCanvas(600, 450);
background(220);
text("p5.js vers 0.9.0 test.", 10, 15);
}
function draw() {
background(max(mouseX/2, mouseY/2), 200, 255);
noStroke();
//little fish bottom left swimming in circles
push();
translate(350, 60);
rotate(radians(-angle));
fill(190, 88, 77);
ellipse(0, 0, 100, 45);
triangle(0, 0, 60, -30, 60, 30);
//little fish top right swimming in circles
pop();
push();
translate(60, 350);
rotate(radians(angle));
fill(190, 88, 77);
ellipse(0, 0, 100, 45);
triangle(0, 0, 60, -30, 60, 30);
pop();
angle += 2;
//little fish swimming through the ripples
fill(190, 88, 77);
ellipse(mouseX, mouseY, 100, 55);
triangle(mouseX, mouseY, mouseX-60, mouseY-30, mouseX-60, mouseY+30);
//water ripples
//restrict mouseX to 0-450
var mX = max(min(mouseX, 700), 0);
//sizing of circles based on mouseX
var size1 = mouseX;
var size2 = mX/2;
var size3 = mX/3;
var size4 = mX/4;
var size5 = mX/5;
//first water drop
fill(50, 0, mouseX/2, 100);
ellipse(20, height/2, size1);
ellipse(20, height/2, size2);
ellipse(20, height/2, size3);
ellipse(20, height/2, size4);
ellipse(20, height/2, size5);
push();
//second water drop
translate(150, 0);
if (mouseX >= width/3) {
//delays time of expansion with mouse
var offset = -30;
//circle
fill(50, 50, mouseX/2, 80);
ellipse(20, height/2, size1+offset);
ellipse(20, height/2, size2+offset);
ellipse(20, height/2, size3+offset);
ellipse(20, height/2, size4+offset);
ellipse(20, height/2, size5+offset);
}
//third water drop
pop();
push();
translate(300, 0);
if (mouseX >= width/2) {
//delays time of expansion with mouse
var offset = -60;
//circles
fill(50, 100, mouseX/2, 60);
ellipse(20, height/2, size1+offset);
ellipse(20, height/2, size2+offset);
ellipse(20, height/2, size3+offset);
ellipse(20, height/2, size4+offset);
ellipse(20, height/2, size5+offset);
}
//fourth water drop
pop();
push();
translate(400, 0);
if (mouseX >= width/2+100) {
//delays time of expansion with mouse
var offset = -80;
//circles
fill(50, 150, mouseX/2, 40);
ellipse(20, height/2, size1+offset);
ellipse(20, height/2, size2+offset);
ellipse(20, height/2, size3+offset);
ellipse(20, height/2, size4+offset);
ellipse(20, height/2, size5+offset);
}
//fifth water drop
pop();
push();
translate(500, 0);
if (mouseX >= width/2+150) {
//delays time of expansion with mouse
var offset = -80;
//circles
fill(50, 200, mouseX/2, 40);
ellipse(20, height/2, size1+offset);
ellipse(20, height/2, size2+offset);
ellipse(20, height/2, size3+offset);
ellipse(20, height/2, size4+offset);
ellipse(20, height/2, size5+offset);
}
}
This is my pond with swimming and rotating fish, I started with the idea of visualizing water droplets from rain, then thought it would be cool to add the motion of a fish swimming in it.
Looking Outwards-02
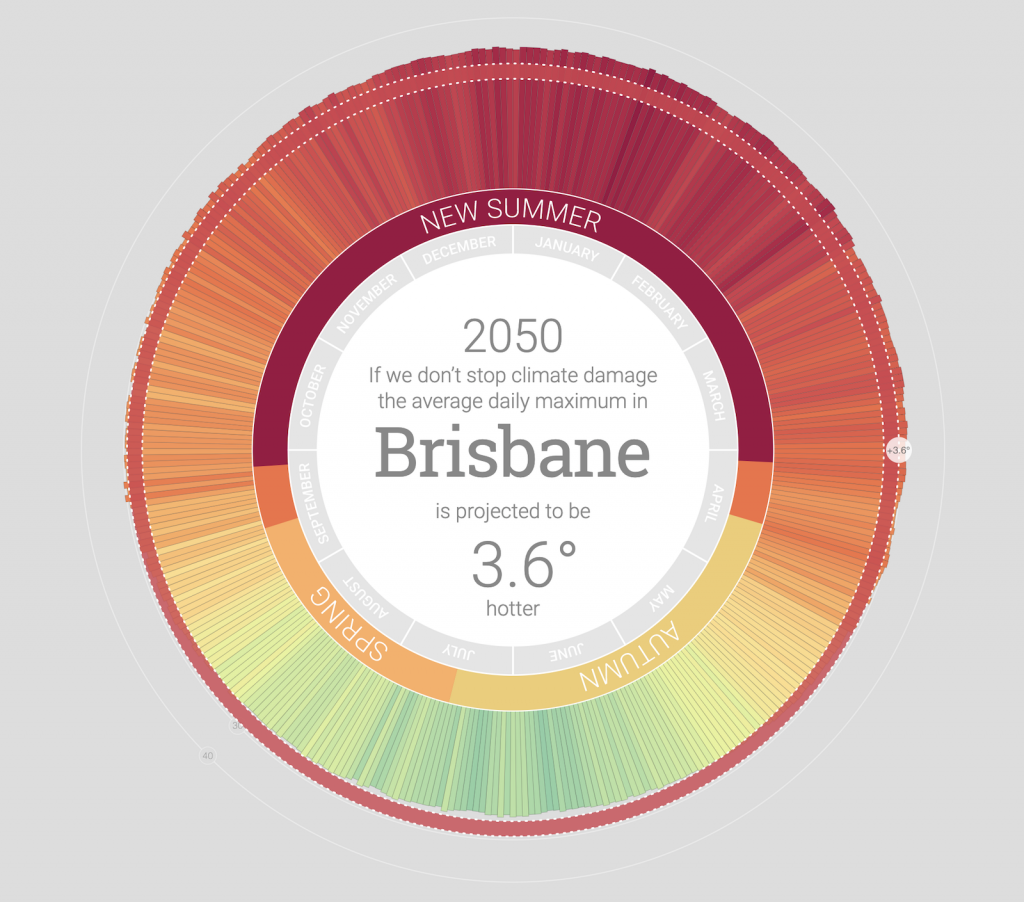
This project by Mitchell Whitelaw is called the “My Climate 2050” project created in December 2018. It generates a visualization tool in Australia that visualizes the impacts of climate change of local areas. The project uses the datasets from the government and climate institutes, which contains around 4700 data projections about the temperature, seasonality, etc. The project reveals that at almost all of the recorded locations, the average temperature year-round is increasing, which signifies an alarming phenomenon of extended summer periods.
I think that the visuals and aesthetics of this tool is effective because of the display of colors and details. I am inspired by this because of how generative art like this can be really useful for our understanding of the climate crisis right now.
Project 02: Variable Faces
var bodyWidth = 270;
var bodyHeight = 340;
var eyeWidth = 11;
var eyeHeight = 12;
var mouthWidth = 20;
var mouthHeight = 10;
var armLY = 290
var armRY = 280
var legLX = 250
var legRX = 350
var backgroundR = 243;
var backgroundG = 127;
var backgroundB = 135;
function setup() {
createCanvas(600, 600);
background(220);
text("p5.js vers 0.9.0 test.", 10, 15);
}
function draw() {
background(backgroundR, backgroundG, backgroundB);
//left arm
stroke(169, 124, 80);
line(width/2-200, armRY, width/2, height/2);
//right arm
stroke(169, 124, 80);
line(width/2, height/2+20, width/2+200, armLY);
//left leg
stroke(169, 124, 80);
line(legLX, height/2+200, width/2, height/2);
//right leg
stroke(169, 124, 80);
line(width/2, height/2, legRX, height/2+200);
//body shape back
fill(134, 197, 74);
stroke(30, 69, 37);
strokeWeight(15);
ellipse(width/2, height/2, bodyWidth, bodyHeight);
//body shape front
noStroke()
fill(201, 221, 101)
ellipse(width/2, height/2, bodyWidth-30, bodyHeight-30);
//seed
fill(169, 124, 80);
circle(width/2, height/2+50, 150);
//eyes
fill(0)
var eyeLX = width/2 - bodyWidth*0.15;
var eyeRX = width/2 + bodyWidth*0.15;
ellipse(eyeLX, height/2.45, eyeWidth, eyeHeight); //left eye
ellipse(eyeRX, height/2.45, eyeWidth, eyeHeight); //right eye
//mouth
var mouthY = height/2 - bodyHeight*0.13
if (eyeWidth > eyeHeight) {
arc(width/2, mouthY, mouthWidth, mouthHeight, PI, 2*PI);
}
else {
fill(247, 165, 170)
arc(width/2, mouthY, mouthWidth, mouthHeight, 2*PI, PI);
}
}
function mousePressed() {
bodyWidth = random(220, 345);
bodyHeight = random(300, 370);
eyeWidth = random(7, 20);
eyeHeight = random(6, 20);
mouthWidth = random(20, 30);
mouthHeight = random(10, 50);
armLY = random(280, 360);
armRY = random(210, 320);
legLX = random(220, 270);
legRX = random(320, 370);
backgroundR = random(180, 270);
backgroundG = random(130, 200);
backgroundB = random(135, 160);
}
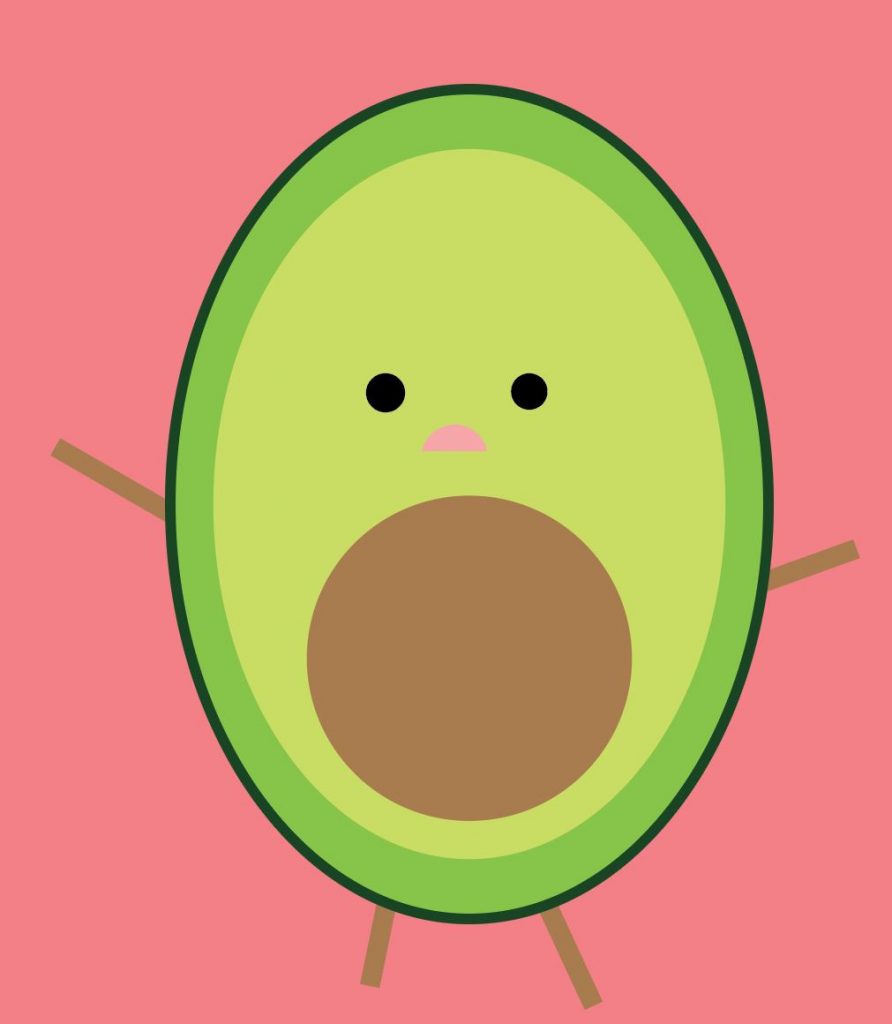
The process of coding this avocado was really fun. I enjoyed seeing the different features come together at the end and all the combinations that it created. Here is my sketch in illustrator: