LO-05 3D Computer Graphic

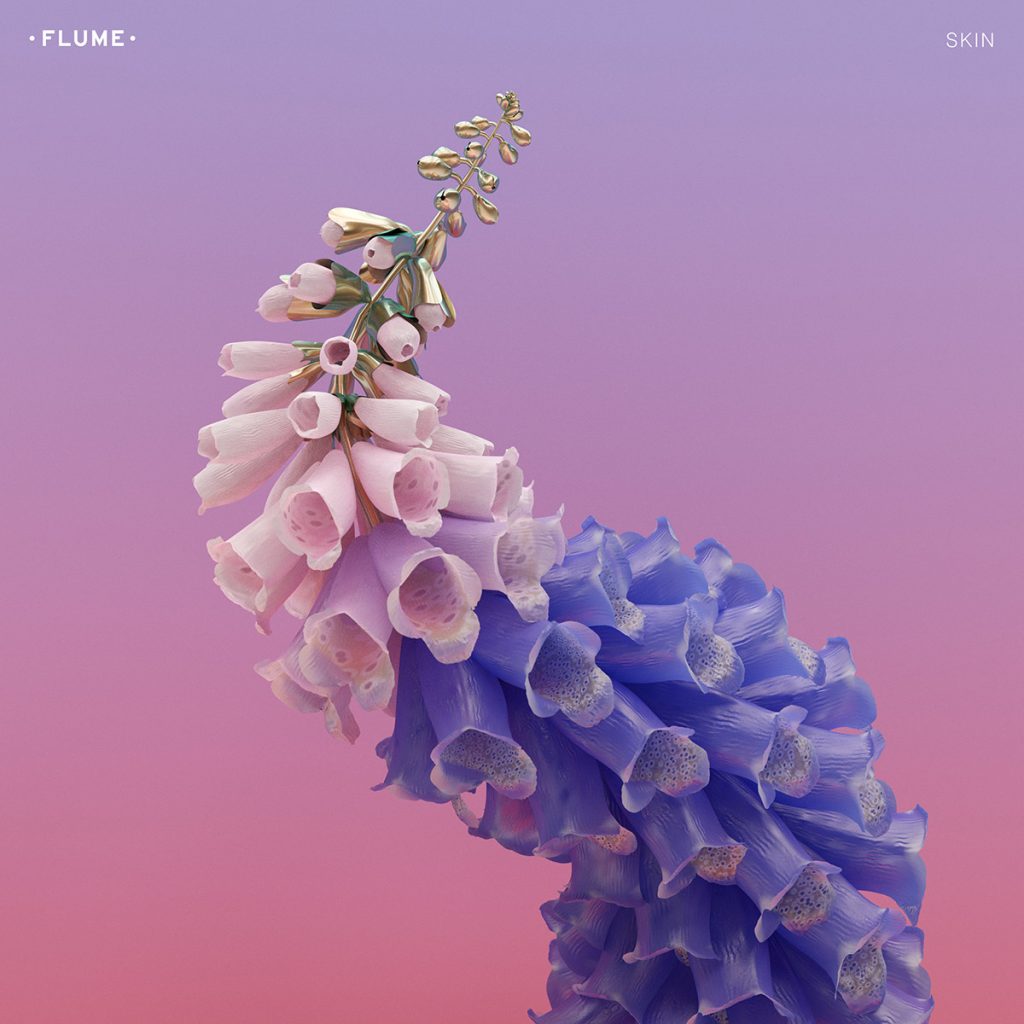
“Skin” Johnathan Zawada, 2016

In 2016, Johnathan Zawada created “Skin” for Flume’s Grammy-winning album of the same name. Zawada created this 3D computer graphic with node structures and algorithms to generate different variations of the flower petals and patterns/textures on the petals. He also used Adobe programs in editing.

I admire the level of detail in this piece. Zawanda created intricate patterns on each petal creating a really interesting composition in contrast to the simplicity of the background. I also admire how his use of color evokes the same emotion as the music from the album. This sync between the imagery and the sound enhances the experience of the song.

Zawada’s artistic sensibilities are seen in this piece through the balance of “light and feathery” like the flowers and “concrete” elements like the silver bells. Zawada states he wanted to “explore ways of making the digital become organic and find tension points between comfort and discomfort.” Zawada went on to create more audiovisuals for Flume’s live shows and future albums.

The Creator’s Project interview with Zawada, 2:08-3:05 discusses “Skin”


Looking Outwards – 04

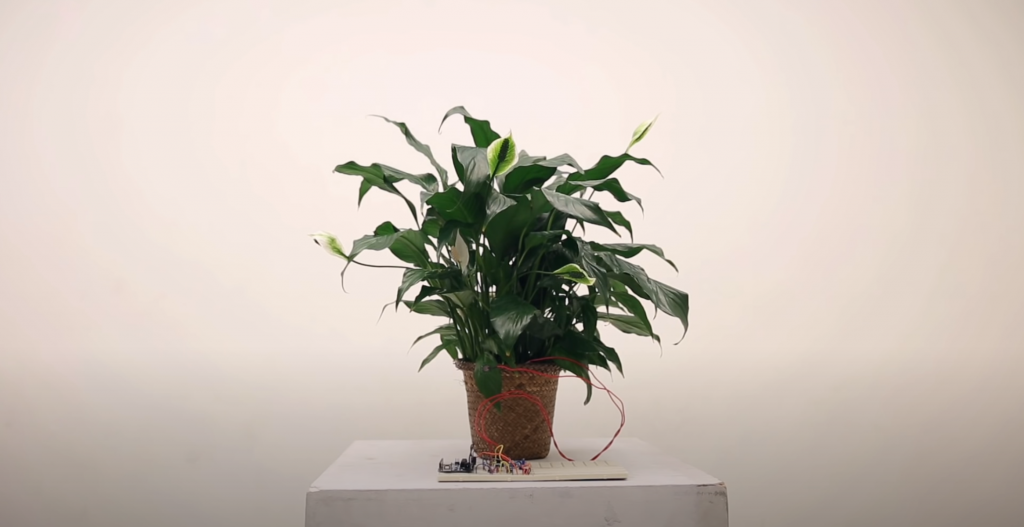
The project I chose to learn more about was a project called “Plant Sounds” by TomuTomu . The project looks at the sounds various plants emit by “translating the electrical micro-voltage fluctuations” generated by the plants. This signal is then coded and used to produce a soundscape. What’s so interesting about this design is that the sounds come out so smooth and beautiful and that the plant is able to create that. I think for them to build this they would’ve needed to code the input values of the plant, from their electrical micro-voltage fluctuations, and assign values to them that would then relate to the code what time of sound output matches each value. I think the creator’s sensibilities lie in the sounds that are outputted because though the plant gives a specific value for the sounds, the creator decides which pitch is assigned to which value. I also linked another project regarding a similar project but one that experiments with adding voltage to plants and graphing out their molecular DNA changes to this signal. This is the TED talk by Greg Gage.

Plant Sounds : TomuTomu

Link for “Plant Sounds”: //www.youtube.com/watch?v=VvWPT4VhKTk&ab_channel=TomuTomu

Link for TED talk: //www.youtube.com/watch?v=pvBlSFVmoaw&t=1s&ab_channel=TED

Project 4 – String Art

>sketch

												//Bennett Goeke
var angle = 0	

function setup() {
    createCanvas(400, 400);
    background(50);
    
}

function draw() {
	strokeWeight(10)								// background lines
	stroke(255, 0, 255)								// pink
	for (x = 0; x <= width; x += 30)
		line(x, 0 , x, height)						//repeating lines in loop

	noFill();
	stroke(0);										// black
	push();
	translate(200, 200)								// origin moved to center
	rotate(radians(angle));							// rotates record
	strokeWeight(1);
	for (var r = 100; r <= 250; r += 4){			// repeating circles 
		circle( 0, 0, r)
	}
	strokeWeight(10)
	fill(27);							// shade of black
	circle(0, 0, 100);					// inner fill circle of record
	
	translate(-200, -200);						// origin back to 0,0
	stroke(255, 255, 0);					//yellow				
	for (var y = 180; y <= 220; y += 5){
		line(180, y, 200, 200)				// yellow V-shape
	}
	push();
	translate( 200, 200);				// origin back to center			
	fill( 255, 0, 0);					// red				
	rect( 10, -20, 15, 40);				// yellow label with red inside
	pop();						

	angle += 3						// rotataing angle increases 3 degrees per frame
	pop();   

}

I decided to make a spinning record with a gold label and then kind of transformed into into a logo of sorts.

Project-04-String-Art

sketch

// Xander Fann xmf Section B
var bx = 0
var len = 10
var up = 0
function setup() {
    createCanvas(400, 300);
    background(0);
}

function draw() {
  push()
    translate(0,up)
    background(255)
    stroke(200,200,255)
      for (var y = -5000; y <= 5000; y += 5){
        line(bx,y,bx+width,y);
      }
    //balloon
      noFill()
      stroke(255,0,0) // red
      for(var arcH = 0; arcH <= 130; arcH += 3){
        arc(200,180,arcH,130,-PI/2,PI/2)
      }


      noFill()
      stroke(0,255,0) // green
      for(var arcH = 0; arcH <= 130; arcH += 3){
        arc(200,180,arcH,130,PI/2,-PI/2)
      }

      noFill()
      stroke(0,0,255,70) // blue
      for(var arcH =- 70; arcH <= 0; arcH += 1){
        arc(200,180,arcH,130,PI/2,-PI/2);arc(200,180,arcH,130,-PI/2,PI/2)
      }
    //basket
    //basket horizontal
      stroke(214, 174, 56)
      for(var y = 260; y<= 290; y += 2){
        line(180,y,220,y)
      }
    //basket vertical
      stroke(214, 174, 56)
      for(var x = 180; x <= 220; x += 2){
        line(x,260,x,290)
      }
    //connection strings
      stroke(0)
      for(var x = 160; x <= 240; x += 20){
        line(x,230,200,260)
    }
    //movement
      up -= 3
      if (mouseIsPressed) {up += 10}
    pop()

    //moutains
    noFill()
    stroke(100,255,0)
    for(r = 200; r<= 300; r += 3)
    ellipse(200,400,800,r)
}

I started by thinking about how the density of strings can affect each other and how overlapping strings is similar to the idea of hatching make an object look 3 dimensional like a sphere. I thought of a hot air balloon where multiple colors can also be used to show the roundness of the balloon. When the screen is pressed the balloon also moves downwards.

Project 4: String Art

yosemite
let yPerl = 0.0;

function setup() {
  createCanvas(400, 300);
  
  pinkSky = color(252, 224, 217);
  blueSky = color(190, 228, 235);
  mountainColor = color(46, 130, 129);
  treeColor = color(162, 179, 137);
  sunColor = color(255, 181, 181);
}

function draw() {
    background(0);

    //the sky
    let changeSky = map(mouseY, 0, height, 0, 1);
    var skyColor = lerpColor(pinkSky, blueSky, changeSky);
    fill(skyColor);
    rect(0, 0, width, height/1.5);

    //the sun
    noStroke();
    ellipseMode(CENTER);
    fill(sunColor);
    var stopMouseX = constrain(mouseX, 100, 300);
    var stopMouseY = constrain(mouseY, 0, 300);
    let sunX = map(stopMouseX, 0, width, 0, 400);
    let sunY = map(stopMouseY, 0, height, 0, 300);
    ellipse(sunX, sunY, 90, 90);
  
    //generative mountains
    fill(mountainColor);
    beginShape();
    let xPerl = 0;
    for (let x = 0; x<= width; x += 10) {
        let y = map(noise(xPerl), 0, 1, 200, 50);
        vertex(x, y);
        xPerl += 0.2;
    }
  
    yPerl += 0.2;
    vertex(width, height);
    vertex(0, height);
    endShape(CLOSE);
  
    //trees
    push();
    for (var i = 0; i <= 400; i += 1) {
        stroke(treeColor);
        strokeWeight(0.5);
        line(50, i + 50, i, height); //1st tree from the left
        line(100, i + 20, i + 50, height + 25); //2nd tree
        line(150, i + 70, i + 70, height + 50); //3rd tree
        line(225, i + 80, i + 200, height + 50); //4th tree
        line(width/2, i + 125, i + 150, height); //5th tree
        line(300, i + 60, i + 250, 300); //6th tree
        line(350, i + 100, i + 300, 350); //7th tree
        line(400, i + 100, i + 350, 400); //8th tree on far right
  }
    pop();
}

I was loosely inspired by the sunrises and sunsets at Yosemite National Park. The mountains regenerate randomly every time the page is reloaded.

Looking Outwards 04: Sound Art

Christine Sun Kim’s Elevator Pitch is an interactive art installation that
celebrates the Deaf community of New Orleans and their vitality to a city
that’s world-renowned as the birthplace of jazz music. Kim, who is Deaf,
created the piece to reference her childhood memories of shouting with her
Deaf friends in elevators in order to feel the vibrations and echoes of
their voices in the confined space.

Participants can press buttons in the elevator that feature the voices
of thirteen different people from New Orleans’ Deaf community. The
elevator is a thoughtful structure that challenges the idea of “awkward
silence” in elevators and highlights how ableism can permeate in even the
most innocuous spaces.

Installation Link

PROJECT 04 – STRING ART

sketch
var dx1;
var dy1; 
var dx2;
var dy2;
var numLines = 40;

function setup() {
    createCanvas(400, 300);
    background(0);

    line(400, 150, 400,  300)

    dx1 = (0 - 0)/numLines;
    dy1 = (200 - 0)/numLines;
    dx2 = (300 - 200)/numLines;
    dy2 = (50 - 400)/numLines;
}

//setting variables
function draw() {
    var x1 = 0;
    var y1 = 0;
    var x2 = 400;
    var y2 = 300;
    var x3 = 0;
    var y3 = 0;
    var x4 = -100;
    var y4 = height;
    var x5 = width;
    var y5 = height;

//blue and pink gradient
    for (var i = 0; i <= numLines; i += 1) {
        stroke(225-i*10, 125-i*10, 225  );
        line(x1, y1, x2, y2);
        x1 += dx1;
        y1 += dy1;
        x2 += dx2;
        y2 += dy2;
    }

//orange and green gradient
    for (var j = 0; j <= 60; j ++) {
        stroke(100+j*10, 200, 140);
        line(x4, height, width, y4);
        x4 += width/20;
        y4 -= height/20;
    }

//green on bottom left
    for (var k = 0; k <= 30; k ++) {
        stroke(25, 255, 255-k*10);
        line(0, y3, x3, height);
        x3 += width/20;
        y3 += height/20;
    }

//pink top left
    for (var z = 0; z <= 20; z ++) {
        stroke(100+z*10, 0, 140);
        line(x5, 0, width, y5);
        x5 -= width/20;
        y5 -= height/20;
    }

}

For this project, I really wanted to test out how curvatures can warp lines into creating new dimensions. I also tried to emphasize the depth by using gradients.

LO – 04 : SOUND ART

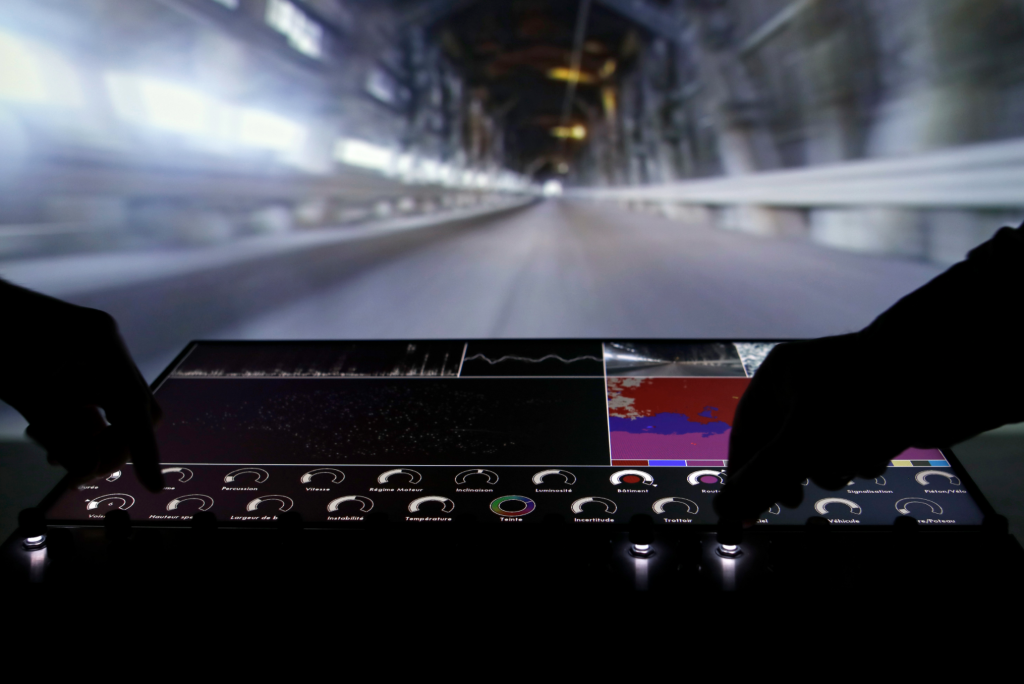
François Quévillion – Algorithmic Drive, 2019

François Quévillon’s “Algorithmic Drive” is a project that I personally found to be very interesting. This project is an interactive installation that was inspired by cars and dash cams. It began with François collecting a large database of recordings from a camera attached to his car’s computer. The data collected includes information on location, orientation, speed, temperature, stabilitiy, etc. This data is fed into a sampling system that uses signal processing, data analysis, and computer vision algorithms that then begins to sort the content statistically. The information is mapped using a Uniform Manifold Approcimation and Projection dimension reduction technique.

This project was interesting to me because it utilizes data and information that surrounds us in our daily life, but is then used to create something new and creative.

Project 4 – String Art

sketch
var carWidth = 20;
var carHeight = 10;
var carA = 0;
var carB = 0;

function setup() {
    createCanvas(400, 300);
    background(220);
    text("p5.js vers 0.9.0 test.", 10, 15);
}

function draw() {
    background(146, 234, 255);
    //left cloud
    fill(235);
    noStroke();
    circle(0, 50, 50);
    circle(40, 50, 70);
    circle(80, 70, 40);
    circle(90, 40, 50);
    //right cloud
    circle(250, 100, 50);
    circle(250, 60, 60);
    circle(300, 80, 100);
    circle(340, 50, 80);
    circle(360, 90, 90);
    //sun
    fill(255, 213, 0);
    circle(200, 300, 200);
    //black car
    fill(0);
    if (carA > width) {
        carA = -carWidth
    }
    carA = carA + 1;
    rect(carA, 240, carWidth, carHeight);
    //green car
    fill(0, 255, 0);

    stroke(100, 0, 0);
    strokeWeight(1);
    push();
    //left bridge lines
    translate(-30, -50);
    for (var i = 0; i <= 120; i += 10) {
        line(0, i + 180, i + 80, 300);
    }
    //middle bridge lines
    translate(100, 0);
    stroke(50, 0, 0);
    for (var i = 0; i <= 210; i += 15) {
        line(300, i + 90, 210 - i, 300);
    }
    //bottom of bridge
    translate(-70, 0);
    for (var i = 0; i <= 12; i += 1.5) {
        line(0, i + 301, 400, i + 301);
        fill(180, 0, 0);
        rect(0, i + 301, 400, 2);
    }
    pop();
    noFill();
    //left top bridge structure
    stroke(190, 0, 0);
    strokeWeight(5);
    rect(-10, 130, 15, 25);
    rect(-10, 160, 15, 25);
    rect(-10, 190, 15, 25);
    rect(-10, 220, 15, 29);
    //left bottom bridge structure
    noStroke();
    fill(150, 0, 0);
    rect(-7, 265, 15, 50);
    //right bridge structure circles
    noFill();
    stroke(190, 0, 0);
    strokeWeight(1);
    circle(340, 35, 7);
    circle(375, 35, 7);
    //right bridge structure
    stroke(180, 0, 0);
    strokeWeight(10);
    rect(340, 41, 35, 40);
    rect(340, 86, 35, 45);
    rect(340, 136, 35, 55);
    rect(340, 186, 35, 60);
    //right bottom bridge structure
    stroke(150, 0, 0);
    rect(340, 270, 35, 50);
    line(340, 270, 375, 305);
    line(375, 270, 340, 305);
    push();
    //right bridge lines
    translate(336, -140);
    stroke(150, 0, 0);
    strokeWeight(1);
    for (var i = 0; i <= 210; i += 15) {
        line(0, i + 180, i + 180, 390);
    }
    pop();
}

My depiction of the Golden Gate Bridge in San Fransisco!

Project – 04 – string art

project 04
// Rouann Chen
// rouanc
// Section B

var angle;
var pos;
var side;

function setup() {
  side = 60;
  createCanvas(400, 400);
  angle = 0;
  pos = p5.Vector.fromAngle(0);
  setRadius();
}

function setRadius() {
  var m = min(width, height);
  var radius = m/2-side*0.6;
  pos.setMag(radius);
}

function drawRect(pos) {
  push();
  translate(pos.x, pos.y);
  rotate(angle);
  rect(-side/2, -side/2, side, side);
  pop();
}

function draw() {
  translate(width/2, height/2);
  drawRect(p5.Vector.mult(pos.rotate(TWO_PI/5), sin(angle)));
  drawRect(p5.Vector.mult(pos.rotate(TWO_PI/5), sin(angle)));
  drawRect(p5.Vector.mult(pos.rotate(TWO_PI/5), sin(angle)));
  drawRect(p5.Vector.mult(pos.rotate(TWO_PI/5), sin(angle)));
  drawRect(p5.Vector.mult(pos.rotate(TWO_PI/5), sin(angle)));

  angle += 0.029;
  pos.rotate(sin(angle)/40);

}

I was inspired by snakes and wanted to draw something that moves infinitely. Instead of using lines, I tried to use endless rectangles connected together to represent a single line.