// Stefanie Suk
// 15-104 Section D

var nPoints = 100; //number of points for curves
var angle = 10; //angle of rotation

function setup() {
    createCanvas(480,480);
    frameRate(15); //set frame rate to 15
}

function draw() {
    background(33, 63, 99); //background of canvas to dark blue

    //placing Hypocycloid in center
    push();
    translate(width/2, height/2);
    Hypocycloid();
    pop();

    //placing Deltoid in center and rotate by angle
    push();
    translate(width/2, height/2);
    rotate(radians(angle));
    angle += mouseX;
    Deltoid();
    pop();

    //placing Epitrochoid in center
    push();
    translate(width/2, height/2);
    Epitrochoid();
    pop();
}

function Hypocycloid(){
    // variables for Hypocycloid
    var a1 = map(mouseY, 0, 300, 150, 180); //size changes with respect to mouseY
    var b1 = 15;
    var c1 = mouseX / 25;

    //color, stroke of Hypocycloid
    stroke(167, 219, 239);
    strokeWeight(6);
    noFill();

    //create curve, map to full circle radians
    //use math function to find x and y values
    beginShape();
    for (var i = 0; i < nPoints; i++) {
        var angle1 = map(i, 0, nPoints, 0, TWO_PI);
        x1 = (a1 - b1) * cos(angle1) + c1 * cos((a1 - b1) * angle1);
        y1 = (a1 - b1) * sin (angle1) - c1 * sin((a1 - b1) * angle1);
        vertex(x1, y1);
    }
    endShape(CLOSE);
}

function Deltoid(){
    colorR = map(mouseX, 0, 50, 100, 255);
    colorG = map(mouseX, 0, 50, 100, 255); //set color in specific range
    colorB = map(mouseY, 0, 50, 100, 255); //changes color with respect to mouseX,Y

    // variable for Deltoid, change size
    a2 = map(mouseY, 0, height, 10, 40); //size changes with respect to mouseY

    //color, stroke, fill of Deltoid
    stroke(255);
    strokeWeight(6);
    fill(colorR, colorG, colorB);

    //create curve, map to full circle radians
    //use math function to find x and y values
    beginShape();
    for (var i = 0; i < nPoints; i++) {
        var angle2 = map(i, 0, nPoints, 0, TWO_PI);
        x2 = ((2 *(cos(angle2))) + (cos(2*angle2)))* a2 ;
        y2 = ((2 *(sin(angle2))) - (sin(2*angle2)))* a2 ;
        vertex(x2, y2);
    }
    endShape(CLOSE);
}

function Epitrochoid() {

    colorR = map(mouseX, 0, 50, 100, 255);
    colorG = map(mouseX, 0, 50, 100, 255); //set color in specific range
    colorB = map(mouseY, 0, 50, 100, 255); //changes color with respect to mouseX,Y

    // variables for epitrochoid
    var a3 = map(mouseY, 0, 400, 40, 110); //size changes with respect to mouseY
    var b3 = 50;
    var c3 = (mouseX / 15);

    //color, stroke of epitrochoid
    stroke(colorR, colorG, colorB);
    strokeWeight(1.5);
    noFill();

    //create curve, map to full circle radians
    //use math function to find x and y values
    beginShape();
    for (var i = 0; i < nPoints; i++) {
        var angle3 = map(i, 0, nPoints, 0, TWO_PI);
        x3 = (a3 + b3) * cos(angle3) + c3 * cos((a3 + b3) * angle3);
        y3 = (a3 + b3) * sin(angle3) + c3 * sin((a3 + b3) * angle3);
        vertex(x3, y3);
    }
    endShape(CLOSE);
}
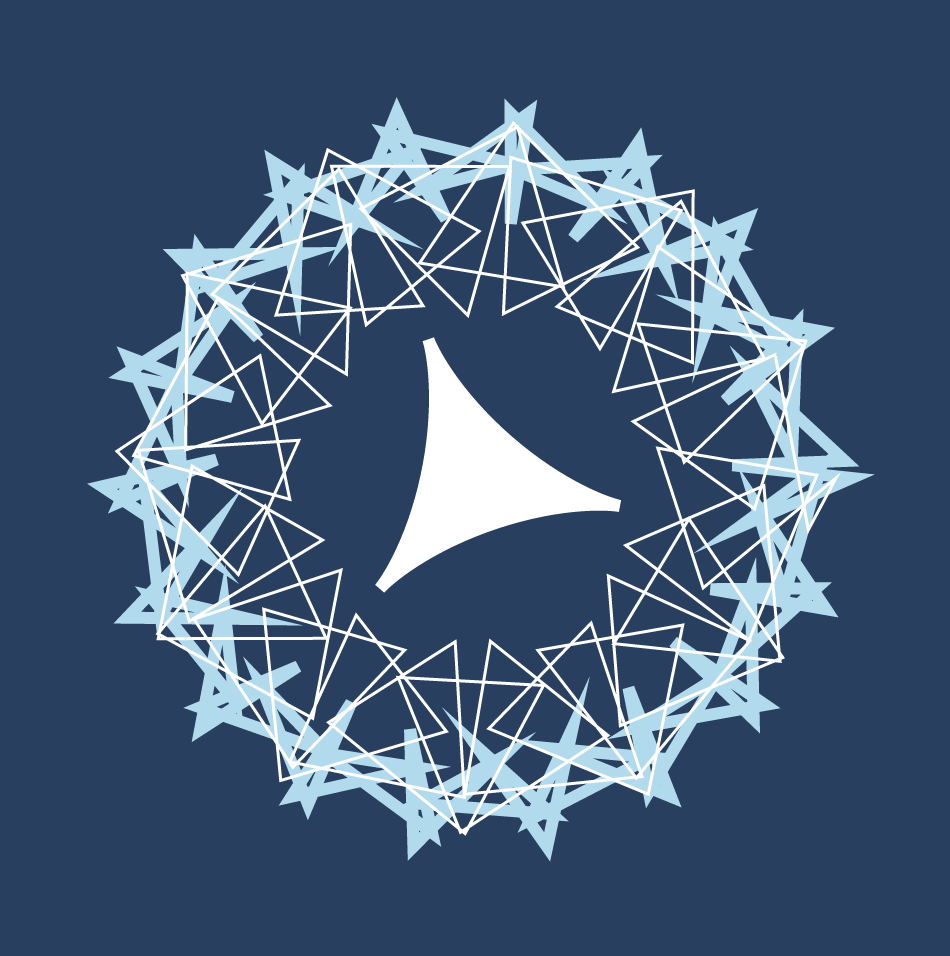
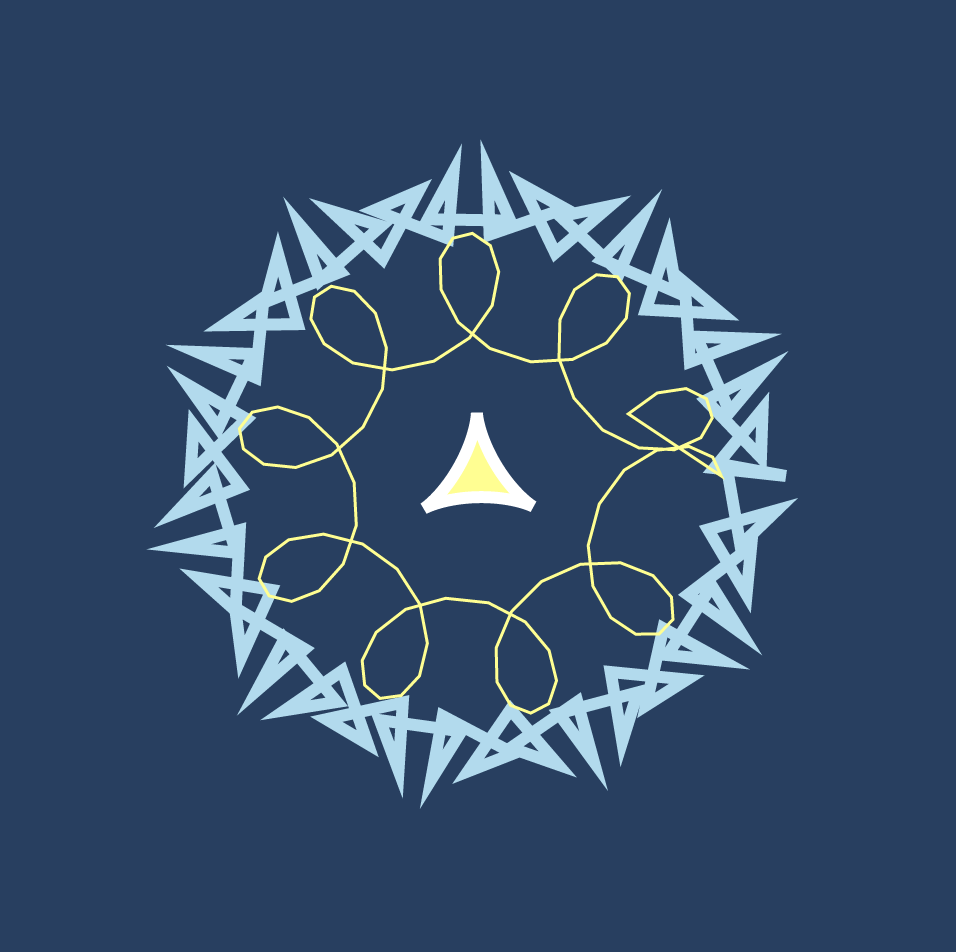
I utilized hypocycloid, deltoid, and epitrochoid using the reference from Mathworld to create this project. I chose these curves because I loved how they were structured. I thought that when these three curves are put together would create one unique interactive shape for my project. The exploration of this project was interesting, and I also played around with random colors and sizes with mouseX and mouseY. The unique part about these curves in my project is that the curves in my work create different smoothness depending on the position of the mouse (round, shape, spiky, squiggly). The different shapes created in the project look like forms of snowflakes, which is why I made the main color blue.


![[OLD FALL 2020] 15-104 • Introduction to Computing for Creative Practice](wp-content/uploads/2021/09/stop-banner.png)