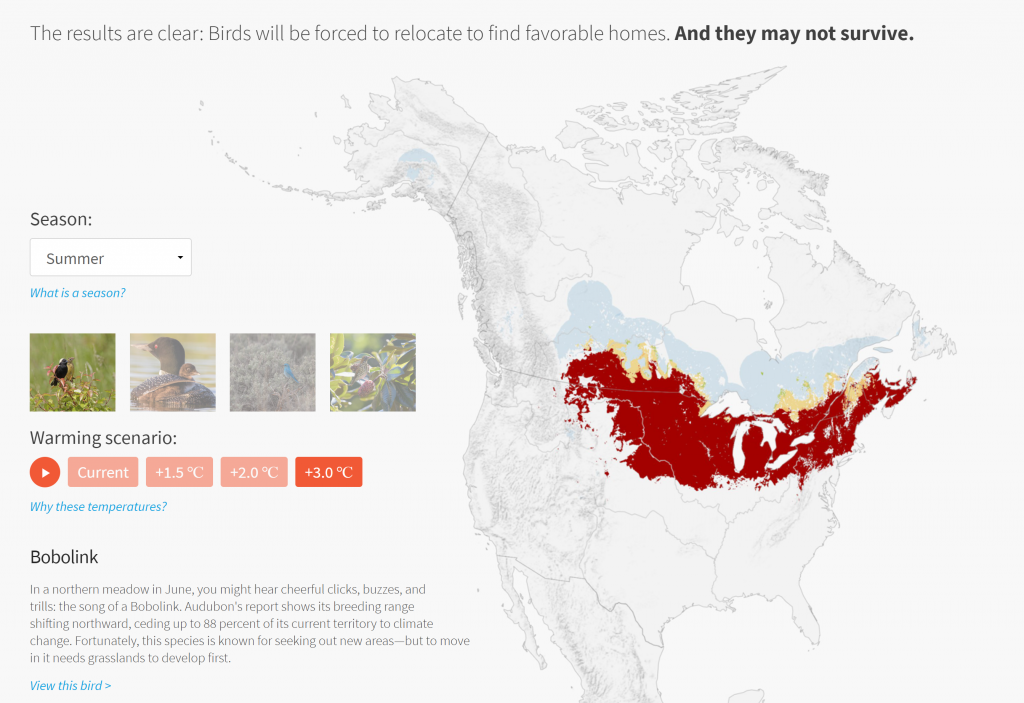
The projects I looked at were from Stamen Studios, they are a studio that creates many types of interactive informational visualizations, especially maps. They help companies/ organizations/individuals to customize their information and present them in the most insightful and legible way possible. One of their projects that I looked at was an interactive map that explores the impact of global warming on North American birds. The map allows you to control what scenario and what season you want to view and uses colors on the map and the species to inform us how much the species is in danger because of global warming. I thought the map delivers information very well and is also really easy to navigate.
http://stamenprod.wpengine.com/work/audubon-survival-by-degrees/
Link to the map:
![[OLD FALL 2020] 15-104 • Introduction to Computing for Creative Practice](wp-content/uploads/2021/09/stop-banner.png)