Student Area

lsh-Drawingbots

I was particularly interested in the plotter.vision utility, which is able to turn a .STL file into an SVG.
Considering how much pain I go through trying to use tools like Make2D in Rhino, or creating a custom view to SVG script in Houdini, having a website that will just do it for me is really nice. I do wish I could get it to use the contours rather than the triangles, however I understand that would probably require significantly more work and processing power.

The image below was generated using the tool.

grape – Hatching

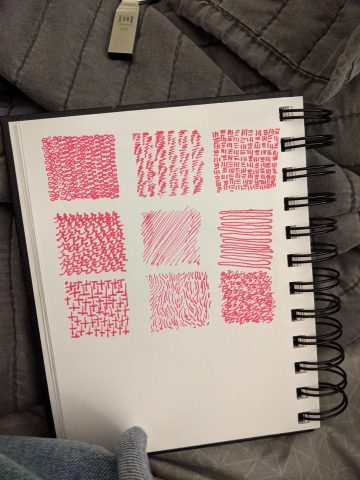
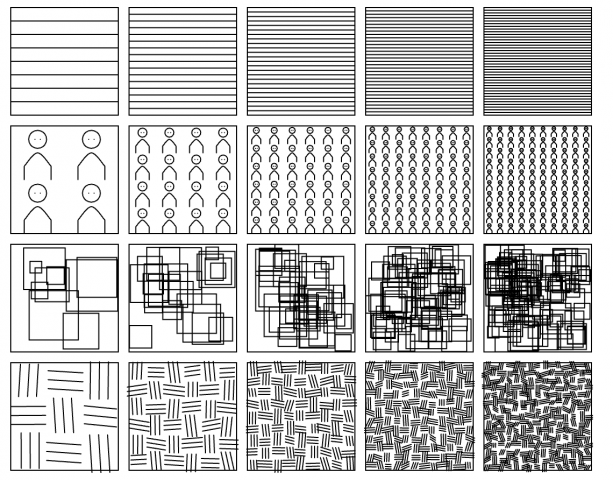
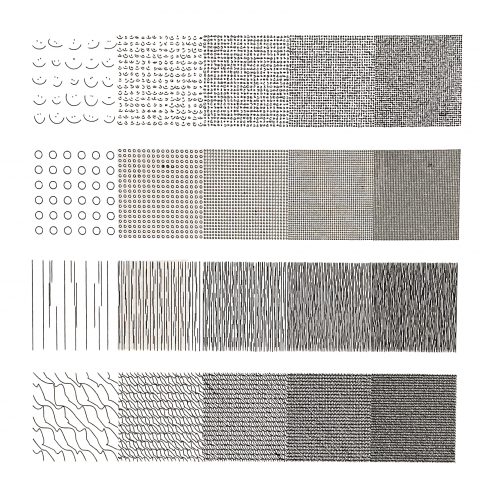
The first hatching method is just a bunch of smiley faces in a grid. The second is a bunch of circles in a grid. The third is some vertical lines, but I added so random lines offset by an amount ranging from 0 to the width of the square grid. The last one is a set of three bezier curves. I didn’t use any external code apart from the grid set up posted in easement 2. I think the difficulty came with trying to make sure they were all the same amount of dark. The third row was especially hard to tune because the vertical lines just appeared so much lighter than the other rows, in part because the colors still looked separate.

Scan of the print (lol):

import processing.svg.*;

float[] percentList = {0.10, 0.30, 0.50, 0.70, 0.90};
int nSquares = percentList.length;

void setup() {
  size(800, 800);
}

void draw() {
  background(250);
  int now = millis();
  randomSeed(now);
  beginRecord(SVG, "foo_" + now + ".svg");
  noFill();
  int offset = (height/4 - int(width/nSquares))/2;
  grid(offset, 0);
  grid(height/4 + offset, 1);
  grid(height/2 + offset, 2);
  grid(3*height/4 + offset, 3);

  endRecord();
  noLoop();
}

void keyPressed() {
  loop();
}


void grid(int posY, int func) {
  for (int i=0; i<nSquares; i++) {
    float rS = width/nSquares;
    float rL = i*rS;
    float rR = rL + rS;
    float rT = posY;
    float rB = rT + rS;

    float hatchPercent = percentList[i];
    float nLinesToDraw = round(hatchPercent * rS/3.2);
    if(func==0) nLinesToDraw = round(hatchPercent * rS/2.3);
    if(func==1) nLinesToDraw = round(hatchPercent * rS/1.8);
    if(func==2) nLinesToDraw = round(hatchPercent * rS/3);
    float offset = (rS/nLinesToDraw)/2;

    // Vertical line version
    for (int j=0; j<nLinesToDraw; j++) {
      for (int k=0; k<nLinesToDraw; k++) {
        float lx = map(j, 0, nLinesToDraw, rL, rR);
        float ly = map(k, 0, nLinesToDraw, rT, rB);
        switch(func) {
        case 0:
          hatch_1(lx+offset, ly+offset, offset);
          break;
        case 1:
          hatch_2(lx, ly, offset);
          break;
        case 2:
          hatch_3(lx+offset, map(min(k+1, nLinesToDraw), 0, nLinesToDraw, rT, rB)+ random(-0.5,0.5), map(max(k-1, 0), 0, nLinesToDraw, rT, rB)+ random(-0.5,0.5));
          hatch_3(min(max(rL,lx + random(-0.5, 0.5)*offset),rR), map(min(k+1, nLinesToDraw), 0, nLinesToDraw, rT, rB)+ random(-0.5, 0.5), map(max(k-1, 0), 0, nLinesToDraw, rT, rB)+ random(-0.5,0.5));
          break;
        case 3:
          hatch_4(lx, ly, offset);
          break;
        }


        //hatch_1(lx,ly);
      }
    }
  }
}

void hatch_1(float posX, float posY, float rad) {
  float smile_start = random(0, QUARTER_PI);
  float n = random(0.3,1) * 3*PI/4;
  float radX = random(0.5,1)*rad*2;
  float radY = random(0.5,1)*rad*2;
  arc(posX, posY, radX, radY, smile_start, smile_start +QUARTER_PI+n);
  circle(posX + random(-0.25,0)*rad,posY+ random(-0.2,0.2)*rad,1);
  circle(posX + random(0,0.25)*rad,posY+ random(-0.2,0.2)*rad,1);
}

void hatch_2(float posX, float posY,float offset) {
  circle(posX+offset, posY+offset, offset);
}

void hatch_3(float posX, float inc1, float inc2) {
  line(posX, inc2, posX, inc1);
}

void hatch_4(float posX, float posY, float offset) {
  bezier(posX,posY,posX+2*offset - random(1)*2*offset, posY+2*offset,posX+random(1)*2*offset,posY,posX+2*offset, posY+2*offset);
  bezier(posX+offset,posY,posX+2*offset - random(1)*offset, posY+offset,posX+random(1)*offset,posY,posX+2*offset, posY+offset);
  bezier(posX,posY+offset,posX+offset - random(1)*offset, posY+2*offset,posX+random(1)*offset,posY,posX+offset, posY+2*offset);
}

lemonbear—Hatching

Hatching studies:

Screenshot:

SVG:

Reflection:

I wasn’t super engrossed by this programming assignment, and I was sort of busy this week so some of these are slightly uninspired. I did think I was being silly/clever with the second row, which is a bunch of people, because Golan described hatching as “approximating gray tones using assemblies of lines“, and I usually think of a bunch of people when I think of the word assembly 🙂

I was told that the third row looked like the effects from super paper mario and the fourth one looked like the patterns on couches from the 80’s, which I thought was really funny. I like these kinds of patterns:

They’re so funny and garish. I could figure out a way to make a fun background for myself in the spirit of these designs. Anyway I’m not really on topic anymore.

Credit: I used this library to export an SVG from p5js.

marimonda – Hatching

(It’s blue because of VPype)

I really enjoyed doing this project, it felt like a fun throwback to drawing exercises and it made me think a lot about how materiality might connect with hatching and values. I wish I had utilized some more specific patterns, like the examples we saw in class with dithering or truchet tiles. But I was having too much fun with the patterns I had already chosen.

I also want to give attribution to Dan Schiffman’s video on the Hilbert Curve, which I adapted to create the fractal pattern in the first block.

Sketches:

First Iteration:


lemonbear—DrawingBots

I thought this sheet music to polyline renderer by LingDong was super interesting!! I like the way text gets plotted with drawing machines in general—it has more of the feel of “art student bored in class copying typefaces” than strictly a pixel by pixel copy of standard fonts. I wonder how you might be able to play with the parameters for generating these polyline SVGs (e.g., randomizing spacing for elements, chaos/jitter of written notes…) or like feeding in a piece that’s been screwed with by the computer, and then screw it up some more.

It also made me think about the possibility of asemic score writing. I’m still considering the philosophical/fucking-with-meaning dimensions of the concept, but it could be something I pursue later in this course.

grape – Drawingbots

After scrolling on the resource list on the drawingbots website I saw a lot of pattern generators like Kolam artworks, medieval city generators (lol, though not really), and contour maps.

One thing I found particularly funny was this city generator that’s supposed to look hand-drawn. It’s strange how something that looks like it could’ve been some first year architecture student’s homework was generated in a matter of seconds, but that’s also the nature of generative artwork I guess.

marimonda – DrawingBots

I really enjoyed looking through the DrawingBots server, in particular I enjoyed looking through the WIPs users posted and it made me contemplate a lot about the diversity of the crew making plotter art. I will not be including any images, in large part because I don’t find it appropriate to post someone else’s art from the server into a public post.
Observations:
1. Medium: It was rare to see a person use anything beside colored micron pens on white paper. There were a few that took advantage of inverse coloring. I really appreciate that many of the people in the community don’t necessarily come from the same background and I think its cool to note some of the general themes. Some people posted about hardware modifications or personal plotter designs, those WIPs were the ones I found most intriguing since it’s a domain so far from my own.
2. Hatching: I paid close attention to some lovely examples of hatching! Like sweetcorn previously mentioned, there is a tendency to stick to either spicy realism or super intense geometry in plotter art. Some of the more complex pieces of plotter art I observed fell into a mix of the two categories and what I really appreciated was the interesting patterns that were used for hatching (which seems to be the common trend in spicy realism).


One piece I particularly liked used voronoi diagrams, where the distance of each point was determined by the value and then these points were interpolated/randomized in a really weird way as to create a very nicely scribbled look to the drawing. The only reason I know voronoi was used was because I asked the person who made it. Very cool.
Another piece I liked used a very Van Gogh-esque field to define values and I noticed many others used complex geometric shapes at different points to create a value.
I feel like these responses often rely on highly mathematical properties to simulate real life, and I really respect that. But I also want them to maybe break it a little.

sweetcorn – DrawingBots

In the discord, someone linked this article about “decorative knotting using Trigonometric Parametrizations.” In it are many equations for creating decorative knots, which I think would fit well in terms of my exploration of flourishes. These equations are for three dimensions, which makes sense because knots have to be three-dimensional, so if I were to implement any of these, I could somehow project this into 2D, which the discord has resources on and links this repo, which could be useful.

sapeck-LostrittoReading

I found it interesting how he separates drawing, computing, and digital images. The concept of the drawing being additive and uneditable makes sense, but that a computer image is not only additive and uneditable is an implied but not always easily seen difference. It is not easily seen because we cannot make another iteration of a drawing as fast as we can make another iteration of a digital image. Sure, the plotter can make repeated drawings, but they are not actually all the same and they take time. You now have to take care into each edit or iteration, or allow for the mishaps and mistakes and unintentional parts to drive the work.

The chapter talks a lot from an architecture perspective.  An example in that field is that people don’t sketch on paper as much anymore. But the definition of sketching and drafting as drawing has been blurred. This blur exists with plotting graphics tools as well: we can visualize a plot on a screen, and we can do our best to make that visualization accurate, but there must be an understanding of how the physical medium works as well to make it worthwhile. Otherwise, plots will look like they were just printed.