I have tried and failed to plot with a pencil before, so Tyler Hobbs’ “9 Tips to Execute Generative Art with a Plotter” was very helpful to me. I think there’s something special about the pencil because of its role in early education. I remember my school did not allow us to use a pen until 6th grade and I remember feeling so frustrated by the dullness of pencils and the flimsiness of mechanical pencils and the smell of pencil sharpeners and them spilling all over the floor.
Student Area
dinkolas – MolnarRecode

I dunno if I’m crazy, but I think the p5 svg thing breaks the pop() function, so I learned how to invert my goddang transformations.
let dosvg = true;
const edgeRoom = 30;
const Wm = 12;
const Hm = 12;
const Lm = 40;
const Sw = dosvg ? 0.8 : 0.015;

function diags(d) {
  push();
  let dangus = randomHalf();

  for (let i = -d + 1; i < d; i++) {
    let x0 = constrain(map(i, 0, d, 0, 1), 0, 1);
    let x1 = constrain(map(i, 0, d, 1, 2), 0, 1);
    let y0 = constrain(map(i, -d, 0, 1, 0), 0, 1);
    let y1 = constrain(map(i, 0, d, 1, 0), 0, 1);
    if (isNaN(x0) || isNaN(x1) || isNaN(y0) || isNaN(y1)) console.log('dingus');
    strokeWeight(Sw);
    line(x0,y0,x1,y1);
  }
  unRandomHalf(dangus);
  pop();
}

function halfdiags(d) {
  push();
  let dangus = randomHalf();

  for (let i = 0; i < d; i++) {
    let x0 = constrain(map(i, 0, d, 0, 1), 0, 1);
    let x1 = constrain(map(i, 0, d, 1, 2), 0, 1);
    let y0 = constrain(map(i, -d, 0, 1, 0), 0, 1);
    let y1 = constrain(map(i, 0, d, 1, 0), 0, 1);
    if (isNaN(x0) || isNaN(x1) || isNaN(y0) || isNaN(y1)) console.log('dingus');
    strokeWeight(Sw);
    line(x0,y0,x1,y1);

  }
  unRandomHalf(dangus);
  pop();
}

function tri(d) {
  push();
  let dangus = randomHalf();

  for (let i = 0; i < d; i++) {
    let x0 = constrain(map(i, 0, d, 0, 1), 0, 1);
    let x1 = constrain(map(i, 0, d, 0.5, 1), 0, 1);
    let y0 = 0; //constrain(map(i, -d, 0, 1, 0), 0, 1);
    let y1 = constrain(map(i, 0, d, 1, 0), 0, 1);
    if (isNaN(x0) || isNaN(x1) || isNaN(y0) || isNaN(y1)) console.log('dingus');
    strokeWeight(Sw);
    line(x0,y0,x1,y1);
  }

  unRandomHalf(dangus);
  pop();
}

function f0() {
  diags(2);
}
function f1() {
  diags(5);
}
function f2() {
  diags(7);
}
function f3() {
  diags(11);
}

function f4() {
  halfdiags(2);
}
function f5() {
  halfdiags(5);
}
function f6() {
  halfdiags(7);
}
function f7() {
  halfdiags(11);
}

function f8() {
  halfdiags(1);
}

function f9() {
  tri(5);
}
function f10() {
  tri(7);
}

function f11() {
  diags(4);
}
function f12() {
  halfdiags(4);
}

function para(d) {
  push();
  let dangus = randomQuarter();

  for (let i = 1; i < d; i++) {
    let x0 = map(i, 0, d, 0, 1);
    let x1 = 1;
    let y0 = 0;
    let y1 = map(i, 0, d, 0, 1);
    if (isNaN(x0) || isNaN(x1) || isNaN(y0) || isNaN(y1)) console.log('dingus');
    strokeWeight(Sw);
    line(x0,y0,x1,y1);
  }

  unRandomQuarter(dangus);
  pop();
}

function f13() {
  para(3);
}
function f14() {
  para(5);
}

let sectionFunctions = [f0, f1, f1, f2, f2, f3, f4, f5, f5, f6, f6, f7, f8, f0, f1, f1, f2, f2, f3, f4, f5, f5, f6, f6, f7, f8, f9, f10, f11, f12, f0, f1, f1, f2, f2, f3, f4, f5, f5, f6, f6, f7, f8, f0, f1, f1, f2, f2, f3, f4, f5, f5, f6, f6, f7, f8, f9, f10, f11, f12, f13, f14];

function setup() {
  if (dosvg) createCanvas(2*edgeRoom + Wm*Lm, 2*edgeRoom + Hm*Lm, SVG);
  else createCanvas(2*edgeRoom + Wm*Lm, 2*edgeRoom + Hm*Lm);
  noLoop();
}

function draw() {
  drawVera();
  /*push();
  translate(10,100);
  scale(0.99,0.5);
  line(0,0,width,height);
  pop();*/
}

function drawVera() {
  //let bg = 240;
  //background(bg);
  clear();
  stroke(0);
  //strokeWeight(0.015);
  strokeWeight(Sw);
  noFill();
  for (let i = 0; i < Hm; i++) {
    for (let j = 0; j < Wm; j++) {
      /*line(edgeRoom + j*Lm, edgeRoom + i*Lm,
          edgeRoom + j*Lm + Lm*0.6, edgeRoom + i*Lm + Lm*0.8);*/
      push();
      translate(edgeRoom + j*Lm, edgeRoom + i*Lm);
      scale(Lm);
      //line(0,0,0.8,0.8);
      drawSection();

      scale(1/Lm);
      translate(-edgeRoom - j*Lm, -edgeRoom - i*Lm);
      pop();
    }
  }
  //fill(bg);
  //noStroke();
  //rect(0,0,edgeRoom,height);
  //rect(width - edgeRoom,0,edgeRoom,height);
}

function keyPressed() {
  saveSVG("vera.svg");
}

function drawSection() {
  //line(0, 0, 0.8, 0.8);
  let r = Math.random();
  let numSections = r < 0.02 ? 0 : r < 0.1 ? 1 : r < 0.8 ? 2 : 3;
  for (let s = 0; s < numSections; s++) {
    let i = Math.floor(Math.random() * sectionFunctions.length);
    let f = sectionFunctions[i];
    f();
  }
}

function randomHalf() {
  let vertical = Math.random() < 0.5 ? 1 : 0;
  let horizontal = 1 - vertical;
  let offset = Math.random() < 0.5 ? 1 : 0;
  let fh = Math.random() < 0.5; //flip horizontal
  let fv = Math.random() < 0.5; //flip vertical

  scale(1 - 0.5*vertical, 1 - 0.5*horizontal);
  translate(vertical * offset, horizontal * offset);
  if (fh) {
    scale(-1, 1);
    translate(-1, 0);
  }
  if (fv) {
    scale(1, -1);
    translate(0, -1);
  }

  return {vertical, horizontal, offset, fh, fv};
}

function unRandomHalf(dangus) {
  let {vertical, horizontal, offset, fh, fv} = dangus;

  if (fv) {
    translate(0, 1);
    scale(1, -1);
  }
  if (fh) {
    translate(1, 0);
    scale(-1, 1);
  }
  translate(-vertical * offset, -horizontal * offset);
  scale(1 / (1 - 0.5*vertical), 1 / (1 - 0.5*horizontal));
}

function randomQuarter() {
  let x = Math.random() < 0.5 ? 1 : 0;
  let y = Math.random() < 0.5 ? 1 : 0;
  let f1 = Math.random() < 0.5;
  let f2 = Math.random() < 0.5;

  scale(0.5,0.5);
  translate(x, y);
  if (f1) {
    scale(-1, 1);
    translate(-1, 0);
  }
  if (f2) {
    scale(1, -1);
    translate(0, -1);
  }

  return {x, y, f1, f2};
}

function unRandomQuarter(z) {
  let {x, y, f1, f2} = z;

  if (f2) {
    translate(0, 1);
    scale(1, -1);
  }
  if (f1) {
    translate(1, 0);
    scale(-1, 1);
  }
  translate(-x, -y);
  scale(2,2);
}
grape – LineWalk
I was mainly inspired by this old Youtube clip in which the person “plays” the Imperial March by writing a math equation. So for my line walk, I wanted something that didn’t necessarily “look” cool, but performed…cool. I wanted to see if the axidraw could sync up to the music. So I started looking through Processing’s Sound Library for anything on pitch detection. Instead I found amplitude and beat detectors which I turned into the following “records.”

waltz of the flowers

we will rock you

rickroll
_______ beat detection ________

take on me

cantina band

bad guy
I think in order to get closer to my goal of an axidraw performance I’m going to look for libraries with pitch detection + maybe smoothing on the output. Otherwise I’ll add an additional threshold to the amplitude and simplify the movement of the record to make different notes more distinct.
code
import processing.sound.*;
import processing.svg.*;

// Declare the sound source and FFT analyzer variables
SoundFile sample;
Amplitude amp;

int num = 3500;
int range = 6;

float[] ax = new float[num];
float[] ay = new float[num];
// Define how many FFT bands to use (this needs to be a power of two)
int bands = 256;
float inc;
float growth;

float smoothingFactor = 0.3;

// Create a vector to store the smoothed spectrum data in
float[] sum = new float[bands];

// Variables for drawing the spectrum:
// Declare a scaling factor for adjusting the height of the rectangles
int scale = 5;
// Declare a drawing variable for calculating the width of the
float barWidth;
float rotater;

void setup() {
  size(768, 768);
  background(255);
  beginRecord(SVG, "badguy.svg");
  rotater = 0.0;
  inc = 0.0;
  growth = 0.05;

  for(int i = 0; i < num; i++) {
    ax[i] = 0;
    ay[i] = 0;
  }
  frameRate(30);

  // Calculate the width of the rects depending on how many bands we have
  barWidth = width/float(bands);

  // Load and play a soundfile and loop it.
  sample = new SoundFile(this, "badguy.aif");
  sample.loop();

  // Create the FFT analyzer and connect the playing soundfile to it.
  amp = new Amplitude(this);
  amp.input(sample);
}

void draw() {
  // Perform the analysis
  translate(width/2, height/2);
  for(int i = 1; i < num; i++) {
    ax[i-1] = ax[i];// *cos(rotater);
    ay[i-1] = ay[i];// *sin(rotater);
  }
  float r = map(amp.analyze(), 0, 0.1, inc, 40+inc);
  float x = r * cos(rotater);
  float y = r * sin(rotater);
  ax[num-1] = x;
  ay[num-1] = y;
  stroke(0);
  for(int i=1; i<num; i++) {
    line(ax[i-1], ay[i-1], ax[i], ay[i]);
  }
  //stroke(255);
  //line(0,0,x,y);
  inc += growth;
  rotater+=0.01;
  if(int(rotater)==360)rotater = 0;
  if(int(inc) == 0) growth = 0.05;
  if(int(inc) == height/3) growth =-0.05;
}

void mousePressed() {
  endRecord();
  exit();
}
the beat detection code is the same as above except you use a new BeatDetector (it also uses the analyze() function). Also my code is pretty terrible. In order to store all the measurements of beats/amplitudes I just used an array (after looking at some brownian motion stuff) which is not good for optimization.
gabagoo-LineWalk


APPROACH: I really wanted to create a line that alternates between lines and curves. I got stuck with applying and reapplying matrix transformation with push() and pop(). I ended up using a stack of matrix transformations. I also wanted the animation of watching the line 'walk' be really satisfying so I used p5.func to use several different easing functions. I found that tuning various parameters in the way I transform the matrix between strokes was incredible sensitive and produced several interesting results.

LIVE EXAMPLE + CODE
let FUNCS = ['quadraticIn', 'quadraticOut', 'quadraticInOut', 'doubleQuadraticBezier', 'doubleQuadraticSigmoid', 'quadraticBezier', 'quadraticBezierStaircase', 'cubicIn', 'cubicOut', 'cubicInOut', 'brycesCubic', 'cubicBezier', 'cubicBezierThrough2Points', 'doubleCubicOgee', 'doubleCubicOgeeSimplified', 'quarticIn', 'quarticOut', 'quarticInOut', 'generalizedQuartic', 'quinticIn', 'quinticOut', 'quinticInOut']
let MIN_SPEED = 5, MAX_SPEED = 15, UPDATE = 0.1
let context = {}
let transforms = []
let e = new p5.Ease()

function setup() {
    createCanvas(windowWidth, windowHeight, SVG)
    angleMode(DEGREES)
    stroke(0)
    strokeWeight(5)
    updateContext(width/2, height/2)

}

function draw() {

    // apply transformations
    push()
    for (const [type, vec] of transforms) {
        switch (type) {
            case 'translate': translate(vec.x, vec.y); break;
            case 'rotate': rotate(atan2(vec.y, vec.x)); break;
        }
    }

    // draw line
    line(...lineargs())

    // exit condition
    if (context.prog >= 1) updateContext(context.width, 0)
    context.prog = min(1, context.prog + UPDATE * context.speed)
    pop()
}

function lineargs() {
    var val = e[context.easing](context.prog) * context.width
    return [0, 0, val, 0]
}

function updateContext(x, y) {
    context.start = createVector(x, y)

    if (context.dir == undefined) context.dir = p5.Vector.random2D()
    else context.dir = createVector(random(-.1, .1), random(1, 4))
    // else context.dir = createVector(1, random(-1, 1))

    context.speed = random(MIN_SPEED, MAX_SPEED)
    context.easing = random(FUNCS)
    context.width = random(random(0,10), random(10, 100))
    // context.width = 5
    context.prog = 0.

    transforms.push(['translate', context.start])
    transforms.push(['rotate', context.dir])
}

function keyPressed() {
    if (key == 'd') {
        noLoop()
        save('plot.svg')
        loop()
    }
}
sapeck-LineWalk
SVG: PNG (screenshot):
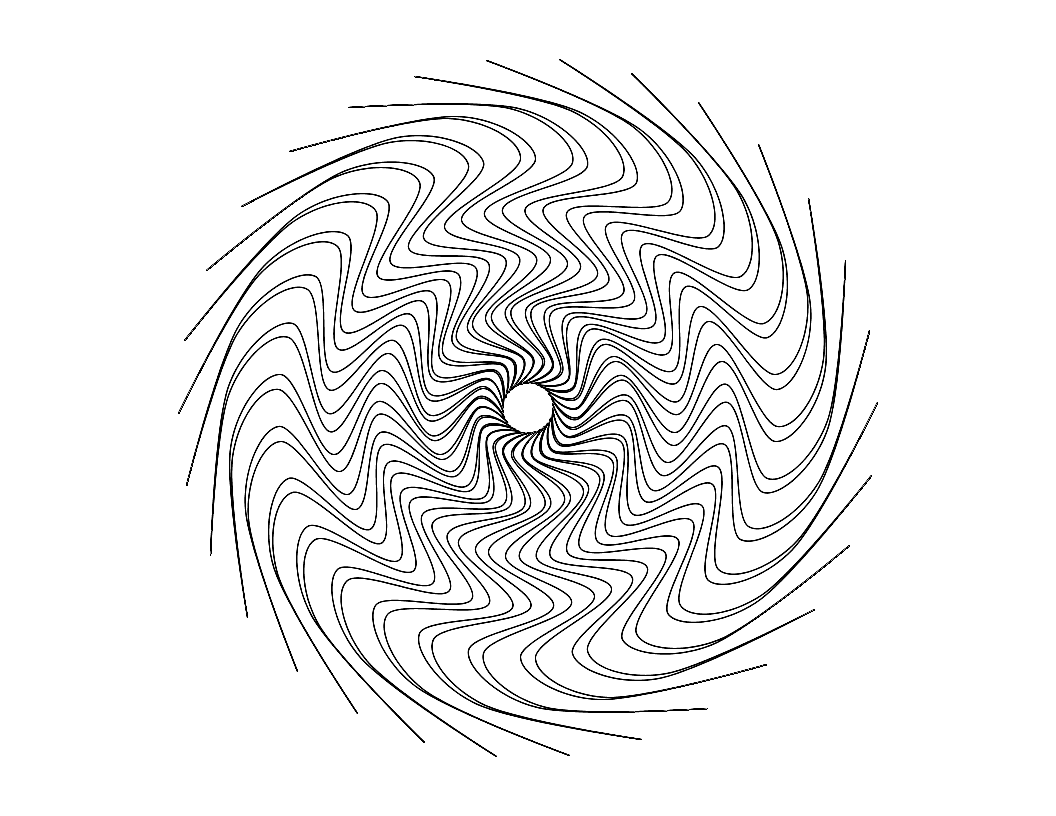
I began with a single curve and moving it in a circle around the center. I then modified the curve to go in and out of the circle to different radii. Next I flipped the in and out movement to be a back and forth movement. Lastly, I added some twist to every other point and exaggerated these twists and extensions.
This assignment pushed my ability to completely understand my code as I was writing it. When I hit a happy accident, I made sure to really think through how my change had affected the output.
/*
* sapeck_LineWalk.pde
* A drawing consisting of a single continuous line
* Originally created by sapeck 2021-09-07
* CMU 60-428 F21 Drawing With Machines
*/

import processing.svg.*;

float[] radii = { .5, 1, 2, 3, 4, 5, 6, 7, 6, 5, 4, 3, 2, 1 };
int MULTIPLIER = 30;
int OUTER = 10;
int OUTER_TWIST = 50;
int DIVISIONS = radii.length * MULTIPLIER;
int SMALLER_COORD = min(width, height);

void setup() {
size(1056, 816); // Letter: 11"x8.5" at 96 DPI.
noLoop();
}

void draw() {
background(255);
beginRecord(SVG, "sapeck-LineWalk.svg");

stroke(0);
noFill(); // Don't create duplicate shapes!

beginShape();

int current_radius = 0;

for (int i = 0; i < (2*DIVISIONS)+3; i++) {
float radius = OUTER;
if (i % 2 == 0) radius = radii[current_radius];
float offset = 0;
if (radius != OUTER) offset -= ((OUTER - radii[current_radius])/max(radii)) * MULTIPLIER*2*PI/DIVISIONS;
float theta = i*2*PI/DIVISIONS + offset;
float scale =(radii[current_radius]*SMALLER_COORD/2);
if (radii[current_radius] == max(radii)) theta -= OUTER_TWIST*2*PI/DIVISIONS;
float x = width/2 - scale*cos(theta);
float y = height/2 - scale*sin(theta);
curveVertex(x, y);
current_radius++;
if (current_radius == radii.length) current_radius = 0;
}

endShape(CLOSE);
endRecord();
saveFrame("sapeck-LineWalk.png");
}
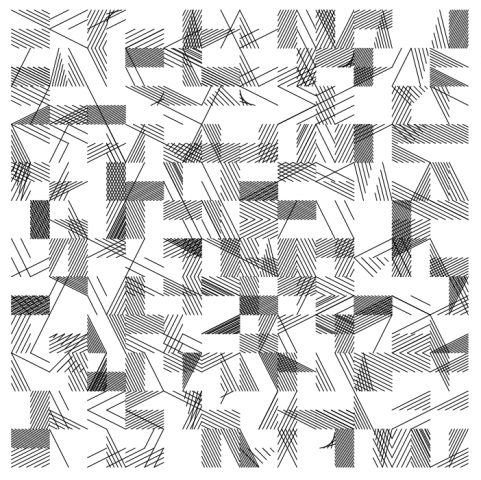
gabagoo-MolnarRecode
Observations: 1. grid of equally spaced squares 2. some squares are split 3. areas are shaded by 'hatching' 4. some areas are split into a triangle 5. the hatching concentration varies 6. sometimes there is no hatching (blank area) 7. hatched areas overlap into cross-hatches 8. there stroke color is black 9. there are some inconsistencies with the hatching 10. the hatching direction is variable^^ SVG ^^
^^ pixel image (from before I messed up the code) ^^
^^ I also experimented with color ^^ LIVE EXAMPLE + CODE
let rows, cols, grain = 15
let colors = ['#eb4034', '#3459eb', '#ffe019', '#404040']

function setup() {
  var SQ_SIZE = min(windowWidth, windowHeight) * .75
  createCanvas(SQ_SIZE, SQ_SIZE, SVG).position((windowWidth - width) / 2, (windowHeight - height) / 2)

  rows = int(width / grain)
  cols = int(height / grain)
  stroke(0)
  strokeWeight(map(grain, 10, 100, .1, 5))
  strokeCap(ROUND)
  noLoop()
}

function draw() {
  background(255)

  for (var i = 0; i < rows; i++) {
    for (var j = 0; j < cols; j++) {

      if (random(0, 1) < .2) {
        drawHatchedRect(i * grain, j * grain, 2 * grain, 2 * grain)
      }
      else {
        if (random(0, 1) < .5) drawHatchedRect(i * grain, j * grain, grain, 2 * grain)
        if (random(0, 1) < .5) drawHatchedRect(i * grain, j * grain, 2 * grain, grain)
      }

    }
  }
}

function drawHatchedRect(x, y, w, h) {

  let divisions = int(random(-3, 10))
  let hatch_dir = random(0, 1) < 0.5
  let sided = random(0, 1) < 0.5

  push()
  translate(x, y)
  if (hatch_dir) {
    rotate(PI/2)
    var temp = w
    w = h
    h = temp
    translate(0, -h)
  }

  // define points
  var top = new p5.Vector(0, 0)
  var bot = new p5.Vector(w, h)
  var rand = random(0, 1) < 0.5
  // stroke(color(random(colors)))

  for (var i = 0; i < divisions; i++) {

    var x_off = i * (w / divisions)
    var y_off = i * (h / divisions)

    if (sided) {
      if (rand) line(top.x, top.y + y_off, bot.x - x_off, bot.y)
      else line(top.x + x_off, top.y, bot.x, bot.y - y_off)
    }
    else {
      line(top.x, top.y + y_off, bot.x - x_off, bot.y)
      line(top.x + x_off, top.y, bot.x, bot.y - y_off)
    }
  }
  pop()

}

function reDraw() {
  grain = int(random(10, 50))
  setup()
  redraw()
}

function mousePressed() {reDraw()}

function keyPressed() {
  if (key == 'd') {
      save('plot.svg')
  }
}

function windowResized() {
  setup()
  reDraw()
}
dinkolas – LineWalk

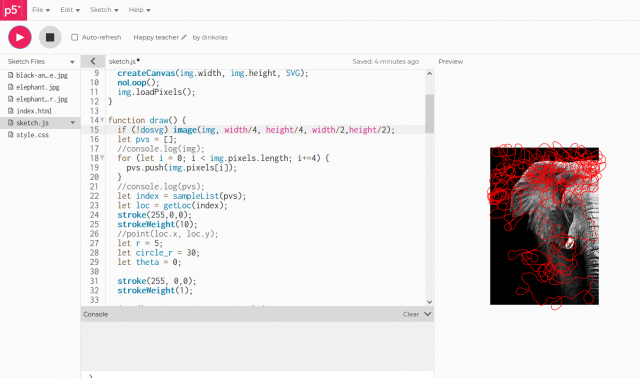
I wanted to try to do a random walk weighted to walk through an image. The line mostly retains its velocity from step to step, but slightly steers towards bright areas. To be honest, it’s not much different from a pure random walk, and I had hoped to have the walks resemble to images much more. I intend to work more on it to improve the results…
const dosvg = false;
let img;

function preload() {
  img = loadImage('elephant.jpg');
}

function setup() {
  createCanvas(img.width, img.height, SVG);
  noLoop();
  img.loadPixels();
}

function draw() {
  if (!dosvg) image(img, width/4, height/4, width/2,height/2);
  let pvs = [];
  //console.log(img);
  for (let i = 0; i < img.pixels.length; i+=4) {
    pvs.push(img.pixels[i]);
  }
  //console.log(pvs);
  let index = sampleList(pvs);
  let loc = getLoc(index);
  stroke(255,0,0);
  strokeWeight(10);
  //point(loc.x, loc.y);
  let r = 5;
  let circle_r = 30;
  let theta = 0;

  stroke(255, 0,0);
  strokeWeight(1);

  for (let i = 0; i < 5000; i++) { let circle = getCircle(loc, theta, circle_r); let weighted = weightList(circle, t => t /*4*(t-0.5)**2*/);
    let circleIndex = sampleList(weighted);
    //let circleIndex = maxIndex(weighted);
    let targetTheta = theta + map(circleIndex, 0, circle.length, 0, 2*PI);


    let diff = ((targetTheta - theta) % TWO_PI + TWO_PI) % TWO_PI;
    if (diff > PI) diff -= TWO_PI;
    theta = (theta + 0.2*diff) % TWO_PI;
    let newLoc = {x: loc.x + r * Math.cos(theta), y: loc.y + r * Math.sin(theta)};
    line(map(loc.x, 0, width, width*0.25, width*0.75),
         map(loc.y, 0, height, height*0.25, height*0.75),
         map(newLoc.x, 0, width, width*0.25, width*0.75),
         map(newLoc.y, 0, height, height*0.25, height*0.75));
    loc = newLoc;
  }
}

function maxIndex(l) {
  let m = -Infinity;
  let id = 0;
  for (let i = 0; i < l.length; i++) { if (l[i] > m) {
      m = l[i];
      id = i;
    }
  }
  return id;
}

function weightList(l, f) {
  let w = [];
  for (let i = 0; i < l.length; i++) {
    let t = map(i, 0, l.length - 1, 0, 1);
    w.push(l[i] * f(t));
  }
  return w;
}

function getCircle(loc, theta, r) {
  let vs = [];
  for (let i = 0; i < 32; i++) { let angle = theta + map(i, 0, 32, 0, 2*PI); let l = {x: loc.x + r * Math.cos(angle), y: loc.y + r * Math.sin(angle)}; let index = getIndex(l); if (index === -1) { vs.push(0); } else { vs.push(1 - (img.pixels[index] / 255.0)); } } return vs; } function getLoc(i) { return {x: i % img.width, y: Math.floor(i / img.width)}; } function getIndex(loc) { if (loc.x >= img.width || loc.y >= img.height ||
     loc.x < 0 || loc.y < 0) return -1;
  return Math.floor(loc.x) + img.width * Math.floor(loc.y);
}

function keyPressed() {
  saveSVG("dingus.svg");
}

function sampleList(l) {
  let v = l[0];
  if (v < 0) console.log('negative!!!');
  let cumsum = [v];
  let sum = v;
  for (let i = 1; i < l.length; i++) {
    let v = l[i];
    if (v < 0) console.log('negative!!!');
    sum += v;
    cumsum.push(sum);
  }
  let t = sum * Math.random();
  //TODO: binary search
  for (let i = 0; i < cumsum.length; i++) { if (cumsum[i] >= t) return i;
  }
  console.log('shouldnt hapen');
  return cumsum.length - 1;
}
aahdee – LineWalk

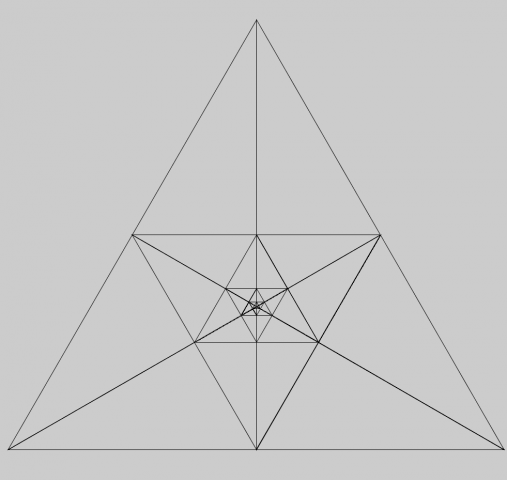
I wanted to do a modified version of an Sierpinski diagram. It was pretty fun to mess around with beginShape(), endShape(), and for loops. I wanted to make it more complex, but I got sleepy from the trig.
I can change the depth and size of the diagram at will, which is nice.
Code is below the read more.
gabagoo-PlotterTwitter
Neon City Sunset 🌇 #generativeart #plottertwitter pic.twitter.com/vFiIwZYt7c
— Brandon Dail (@aweary) September 5, 2021
The works from PlotterTwitter were pretty interesting to me. I thought the there were many creative and unconventional uses of color, pen media, and form. It got kind of redundant with the line patterns, but I found the mixing of colors, particularly in the work linked above to be incredible. What I like about Brandon Dail’s Neon City Sunset (above) is the complexity of the layering. None of the layers have particularly complex elements, mostly circles and squiggles, but the layering of colors creates incredible visual textures.
lemonbear-LineWalk
Here is my SVG (there are very bizarre lines in some browsers; feel free to click and open in a new tab):

Here is a screenshot:
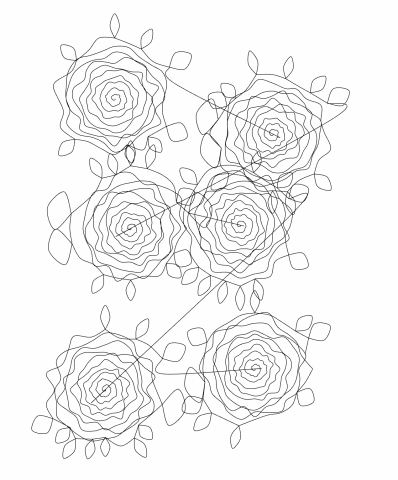
Approach: I knew I wanted to do something sort of objective and I settled on flowers! Namely, roses. I thought it would be pretty simple algorithmically to create a spiral with some jitter for the petals, and after a little more finicky work, I was able to implement leaves on the outer layer of each rose. My friend pointed out that with some color and cursive writing this could be an album cover for an extremely mediocre emo band, and I think I agree with that.
Struggles: I had a little bit of a harder time getting into this creative portion of the homework, and actually found that recreating the Molnar was the most engaging out of these offerings for me. Also, there’s this weird bug where the line connecting one flower to the next’s center overshoots the center, and I spent like 45 minutes trying to debug it before giving up. My primary issue with this is that now it looks like there’s more than one line, but I promise it’s all just one.
Learned: I learned Javascript for these offerings! I had been kind of scared to learn p5.js in the past because I had never done JS before, but I learned that it’s basically gentler C (a language I am somewhat familiar with) plus some idiosyncrasies (there are no ints? everything is just floats? what kind of type system…)
Here is my code:
function setup() {
  createCanvas(816, 1056, SVG);
  noLoop();
}

function draw() {
  noFill();
  beginShape();
  var centerX = width/2;
  var centerY = height/2;
  var finalX, finalY;
  const array = [];
  for (var k = 1; k < 4; k++){
    for(var l = 1; l < 3; l++){
      var jitter1 = Math.floor(Math.random()*101)-50;
      var jitter2 = Math.floor(Math.random()*101)-50;
      array.push([width*l/3+jitter1, height*k/4+jitter2]);
    }
  }
  for (var j = 0; j < 6; j++){
    centerX = array[j][0];
    centerY = array[j][1];
    for (var i = 0; i < TWO_PI*10; i+=HALF_PI/6) {
      var jitter3 = Math.floor(Math.random()*i/2)-i/4;
      var jitter4 = Math.floor(Math.random()*i/2)-i/4;
      if ((jitter3 < 0 && jitter4 > 0) || (jitter3 > 0 && jitter4 < 0)) { jitter3 *= -1; } var x = centerX+cos(i)*(i*2+jitter3); var y = centerY+sin(i)*(i*2+jitter4); curveVertex(x, y); var leafTipX, leafTipY; if (i >= TWO_PI*9 && Math.random()<0.5){
        curveVertex(x, y);
        endShape();
        beginShape();
        curveVertex(x, y);
        curveVertex(x, y);
        leafTipX = (x-centerX)*0.4 + x;
        leafTipY = (y-centerY)*0.4 + y;
        var slope = (y-leafTipY)/(x-leafTipX);
        slope = -1/slope;
        var midX = (x+leafTipX)/2;
        var midY = (y+leafTipY)/2;
        var leftX = midX+10;
        var leftY = midY+10*slope;
        var rightX = midX-10;
        var rightY = midY-10*slope;
        curveVertex(leftX, leftY);
        curveVertex(leafTipX, leafTipY);
        curveVertex(rightX, rightY);
        curveVertex(x, y);
        curveVertex(x, y);
        endShape();
        beginShape();
        curveVertex(x, y);
        curveVertex(x, y);
      }
      finalX = x;
      finalY = y;
    }
  }
  curveVertex(finalX, finalY);
  endShape();
  // saveSVG("line_walk_v1.svg")
}