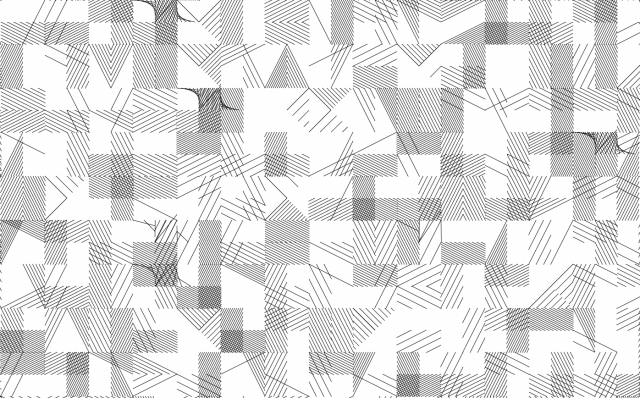
Closeup:
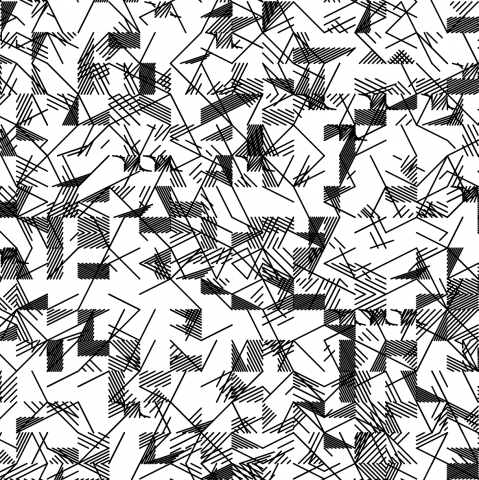
My observations:
- The painting is 68 x 68 grid of square cubes.
- There are three-four tiers of line drawings, one that spans the 68×68 grid, and one that spans the 34×34 grid, drawing over the grid of smaller cubes
- There are at most three types of lines on any square in the grid
- One “lining” either occupies a 1×1, 2×1, 1×2, 1×3 or 2×2 rectangle
- the 1×1 cubes are a line from one corner to the center of the square
- 1×3 rectangles can be one of two patterns. The first of which is composed of two identical 1×1 squares, the left of which has (up to) 4 lines from the top-most side which connect halfway up the adjacent right side of the square. There is also probability of the presence or absence of a single 1/2 length line on the right side. The right square diagonally mirrors the pattern of the left square. Between these identical squares is a 1×1 square which, (for the half to the left of the diagonal) depending on the n number of lines used in the left and right squares maps n equidistant lines from the bottom 1/2 of the square to the to the top of the square, giving a tilted appearance. The lines in the middle square are always diagonal lines reaching from the bottom left corner to the upper right. The second pattern is composed of an obtuse triangle, whose obtuse angle is located in between the middle and rightmost square. the shortest side is along a diagonal on the rightmost square while the longest side connects the bottom left corner of the leftmost square with the top right corner of the rightmost square. There are lines running parallel to the longest leg varying from 1 to 10 (i think…but it’s blurry) that exclude the diagonal.
- 2×1 and 1×2 rectangles can be parallel lines that take up the entire rectangle, parallel lines that take up a right triangle/diagonal half of the rectangle, or only an isosceles triangle amount of the rectangle (where the single side of non equal length is 2) and can vary in number of lines from 1 to 12, though some of these 1×2 or 2×1 rectangles are left blank.
- Similar to rule 7, 2×2 rectangles are either parallel lines that take up the entire rectangle or parallel lines that take up a diagonal half of the rectangle, with lines that vary from 1 to 11. 2×2 rectangles that cover the entire rectangle are completely unobstructed(or at least have a lower probability of being covered up) – they don’t have additional lines over top (other than probability for larger stroke weight for the middle diagonal line), but 2×2 rectangles that only cover a diagonal half can have additional lines.
- To keep in line with the previous rules regarding pattern size, I amend my first observation; the piece is actually 68×70 squares, but the leftmost and rightmost columns have been cut out, such that there appears to be two 68×1 patterns on the edge. There is no such rule for the top and bottom rows, and 2×2 and 1×2 square patterns can be seen in its entirety on the top and bottom rows (excluding the leftmost and rightmost entries)
- Some of the diagonals through 2×1, 1×2, and 2×2 regions look thicker, indicating a possible fifth tier to add in a larger stroke weight…and there’s no white border.
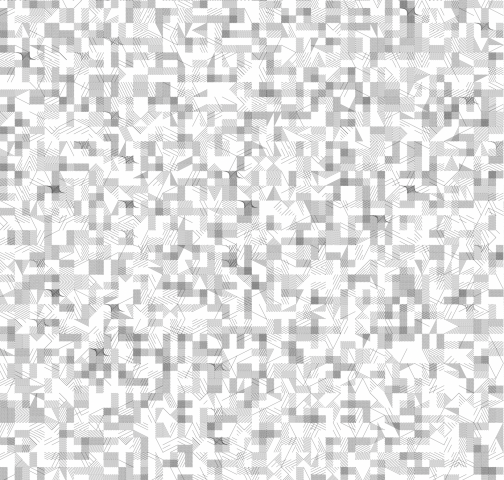
Code:
Overall this experience was pretty annoying because there were so many different types of shapes. Also, even though I had counted the number of lines per shape in the original work, I inevitably had to scale down the number of lines in each shape because they blended together in the resulting svg (e.g. 12 lines down to 7). I think the components are similar to Molnar’s work but I just gave up tweaking the probabilities to make it super accurate. I spent 5 ish hours (which is way too long) on this assignment because I was too obsessed with getting all the shapes. smh.
import processing.svg.*;

int dim = 768;
int xCells = 36;
int yCells = 35;
// dimension of a single 1x1 square
float sDim = dim/(34 * 2);
int[] square;

void settings() {
  size(dim, dim);
}

void setup() {
  square = new int[5];
  noLoop(); // Just execute once!
}

void draw() {
  background(255);
  beginRecord(SVG, "paul-klee-molnar.svg");

  stroke(0);
  noFill(); // Don't create duplicate shapes!
  for (int row =0; row<xCells; row++) {
    for (int col =0; col<yCells; col++) {
      float section = random(1.0);
      if(section<0.2){ //zero items
         // do nothing
      }else if(section <0.2){ // one item
        drawRand(row, col, 1);
      }else if(section < 0.8){ // two items drawRand(row, col, 2); }else{ // three items drawRand(row, col, 3); } if(random(1,0)>0.5){
        if(random(1.0) < 0.5){
          drawDiag(1, row, col,1,2,int(random(0, 2)));
        }else{
          drawDiag(1, row, col,2,int(random(1,3)),int(random(0, 2)));
        }
      }
    }
  }
  endRecord();
}


void drawUniqueDiag(int posX, int posY, int items){
  int x = int(random(1, 3));
  float bias = 0.4;
  if(items ==1) bias = 0.0;
  if(random(1.0)< 0.33){
    int dir = int(random(0, 2));
    if(square[dir] ==0){
      drawDiag(int(random(1, 9)), posX, posY, 1, 2, dir);
      square[dir] = 1;
    }else drawUniqueDiag(posX,posY,items);
  }else {
    if((random(1.0) + bias) < 0.5){
      drawDiag(int(random(1, 9)), posX, posY, 2, 2, int(random(0, 2)));
    }else{
      int dir = int(random(2, 4));
      if(square[dir] ==0){
        drawDiag(int(random(1, 9)), posX, posY, 2, 1, dir-2);
        square[dir] = 1;
      }else drawUniqueDiag(posX,posY,items);
    }
  }
}


void drawRand(int posX, int posY, int items){
  for(int i = 0; i<5; i++){
    square[i] = 0;
  }
  for(int i = 0; i<items;i++){
    float shape = random(1.0);
    if(shape<0.04){ //Obtuse Triangle
      drawObtuse(posX, posY, int(random(1,6)));
    }else if(shape <0.08){ // Fan Thingy
      drawFan(posX, posY, int(random(1,4)));
    }else if(shape < 0.75){ // Diagonal, Half & Full
      drawUniqueDiag(posX, posY, items);
    }else if(shape < 0.96){ // Isoceles Triangle
      drawTriangle(posX, posY, int(random(1, 7)));
    }else{ // Chord
      drawChord(posX,posY);
    }
  }
}


void drawLine(float posXa, float posYa, float posXb, float posYb) {
  // assert that posXa < posXb
  float xa = posXa - sDim;
  float ya = posYa;
  float xb = posXb - sDim;
  float yb = posYb;
  if(xb < 0 || xa >= width){
    //do nothing
  }else{
    if(xa < 0){ float slope = (posYb-posYa)/(posXb-posXa); ya = ya + slope*(-xa); xa = 0; } if(xb > width){
      float slope = (posYb-posYa)/(posXb-posXa);
      yb = yb - slope*(xb-width);
      xb = width;
    }
    line(xa,ya,xb,yb);
  }
}


void drawDiag(int numLines, int posX, int posY, int w, int h, int quad) {
  /* draws diagonal lines for some contraints hxw box
   *
   * numLines are the max number of lines touching a side of the rect
   * posX and poxY indicate square in grid
   */
  float wDist = sDim * w;
  float hDist = sDim * h;
  float wInc = wDist/numLines;
  float hInc = hDist/numLines;
  float baseX = posX*sDim*2;
  float baseY = posY*sDim*2;
  if(h == 1 && quad==1) baseY = baseY + sDim;
  if(w == 1 && quad==1) baseX = baseX + sDim;
  // if dir ==1, then diag goes from bottom left to top right
  boolean dir = boolean(int(random(0, 2)));
  int shape = int(random(0,3));
  if (dir) { // bottom left to top right
    for (int i=0; i<numLines; i++) {
      if(shape == 0){
        // bottom triangle
        drawLine(baseX+(i*wInc), baseY+hDist, baseX+wDist, baseY + (i*hInc));
      }else if(shape ==1){
        // top triangle
        drawLine(baseX, baseY+((i+1)*hInc), baseX+((i+1)*wInc), baseY);
      }else{
        // bottom triangle
        drawLine(baseX+(i*wInc), baseY+hDist, baseX+wDist, baseY + (i*hInc));
        // top triangle
        drawLine(baseX, baseY+((i+1)*hInc), baseX+((i+1)*wInc), baseY);
      }

    }
  } else { // top left to bottom right
    for (int i=0; i<numLines; i++) {
      if(shape ==0){
        // top triangle
        drawLine(baseX+(i*wInc), baseY, baseX + wDist, baseY + (hDist - (i*hInc)));
      }else if(shape ==1){
        // bottom triangle
        drawLine(baseX, baseY + (i*hInc), baseX+(wDist - (i*wInc)), baseY + hDist);
      }else{
        // top triangle
        drawLine(baseX+(i*wInc), baseY, baseX + wDist, baseY + (hDist - (i*hInc)));
        // bottom triangle
        drawLine(baseX, baseY + (i*hInc), baseX+(wDist - (i*wInc)), baseY + hDist);
      }
    }
  }
}


void drawObtuse(int posX, int posY, int numLines) {
  int divider = numLines+1;
  float wInc = (sDim * 2)/divider;
  float hInc = sDim/divider;
  float baseX = posX*sDim*2;
  float baseY = posY*sDim*2;
  for (int i = 1; i <= numLines; i++) {
    drawLine(baseX + (wInc*i), baseY + (sDim*2), baseX+(sDim * 3) - (hInc*i), baseY + sDim + (hInc*i));
  }
}


void drawFan(int posX, int posY, int numLines) {
  int divider = numLines+1;
  float horizSpace = sDim/divider;
  float vertSpace = horizSpace/2;
  float baseX = posX*sDim*2;
  float baseY = posY*sDim*2;
  // terrible code, but I have to separate the three components to satisfy the assert in drawLine
  for (int i = 1; i <= numLines; i++) {
    drawLine(baseX + (horizSpace * i), baseY, baseX + sDim, baseY + (vertSpace * i));
    drawLine(baseX + (2*sDim), baseY + sDim - (i * vertSpace), baseX + (3*sDim) - (i* horizSpace), baseY + sDim);
  }
  for (int i = 1; i<=numLines; i++) {
    drawLine(baseX+sDim, baseY + (sDim/2) + (i*vertSpace), baseX + sDim + (i*horizSpace), baseY);
    drawLine(baseX + sDim + (i*horizSpace), baseY + sDim, baseX + (2* sDim), baseY + (i*vertSpace));
  }
  // diagonal
  drawLine(baseX + sDim, baseY + sDim, baseX + (2*sDim), baseY);
  if (int(random(0, 2)) < 1) {
    drawLine(baseX + sDim, baseY, baseX + sDim, baseY+(sDim/2));
    drawLine(baseX + (2*sDim), baseY + (sDim/2), baseX + (2*sDim), baseY + sDim);
  }
}


void drawChord(int posX, int posY){
  float baseX = posX*sDim*2;
  float baseY = posY*sDim*2;
  if(random(1.0)<0.5){
    drawLine(baseX, baseY + sDim, baseX+(sDim/2), baseY + ((sDim*3)/2));
  }else{
    drawLine(baseX+ ((sDim*3)/2), baseY + ((sDim*3)/2), baseX+(2*sDim), baseY + sDim);
  }
}


void drawTriangle(int posX, int posY, int numLines) {
  int divider = numLines + 1;
  float hInc = (sDim*2)/divider; // hypotenuse, over length 2*sdim
  float dInc = sDim/divider; // shorter legs that rest on the diagonal of the grid
  float baseX = posX*sDim*2;
  float baseY = posY*sDim*2;
  int position = int(random(0, 4));
  if (position==0) { //up down triangles
    int dir = int(random(0, 2));
    for (int i = 1; i <= numLines; i++) {// 0 top, 1 bottom
      float ax = i*hInc;
      float ay = dir*2*sDim;
      float bx = sDim + (i*dInc);
      float by = sDim + (((2*dir)-1)*dInc*i);
      drawLine(baseX + ax, baseY + ay, baseX + bx, baseY + by);
    }
  } else if (position==1) { //up down triangles
    int dir = int(random(0, 2));
    for (int i = 1; i <= numLines; i++) {// 0 top, 1 bottom
      float ax = i*dInc;
      float ay = sDim + ((2*dir)-1)*(sDim -(dInc*i));
      float bx = i*hInc;
      float by = dir*2*sDim;
      drawLine(baseX + ax, baseY +ay, baseX + bx, baseY + by);
    }
  } else if (position==2) { //left right triangles
    int dir = int(random(0, 2));
    for (int i = 1; i <= numLines; i++) { // 0 left, 1 right
      float ax = dir * (sDim + (i*dInc));
      float ay = (-dir+1)*i*hInc + dir*(sDim+(i*dInc));
      float bx = (-dir+1)*(sDim - (i*dInc)) + dir*2*sDim;
      float by = (-dir+1)*(sDim + (i*dInc)) + dir*i*hInc;
      drawLine(baseX + ax, baseY + ay, baseX + bx, baseY + by);
    }
  } else { // left right triangles
    int dir = int(random(0, 2));
    for (int i = 1; i <= numLines; i++) { // 0 left, 1 right
      float ax = dir*(sDim + (i*dInc));
      float ay = (-dir+1)*i*hInc + (dir*(sDim+(i*dInc)));
      float bx = (-dir+1)*i*dInc + dir*2*sDim;
      float by = (-dir+1)*i*dInc + dir*i*hInc;
      drawLine(baseX + ax, baseY + ay, baseX + bx, baseY + by);
    }
  }
}

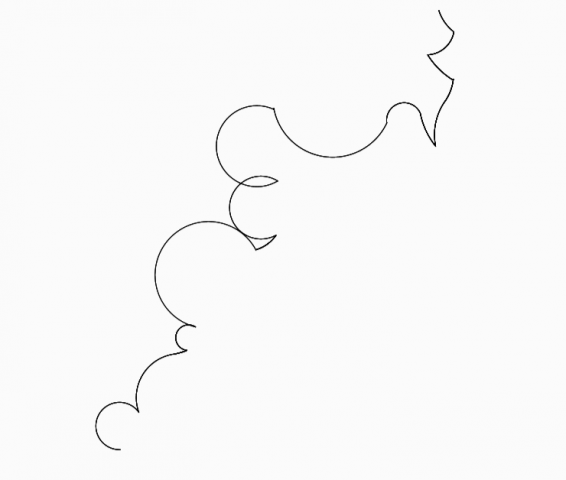


 That honestly blew my mind because I really didn’t expect anything like that but I loved the combination of both fine lines and more doodle-like lines in creating this project.