Student Area

miniverse – MolnarRecode

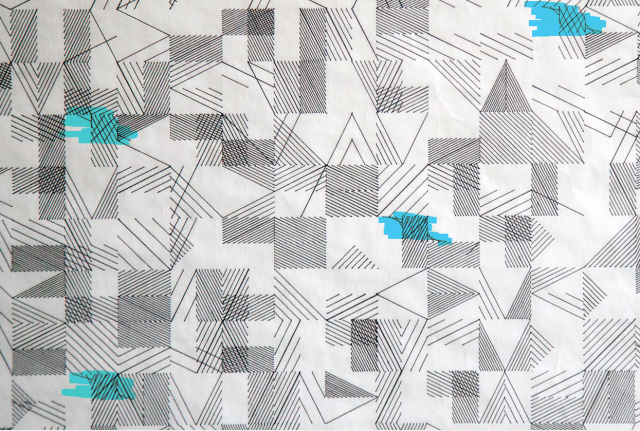
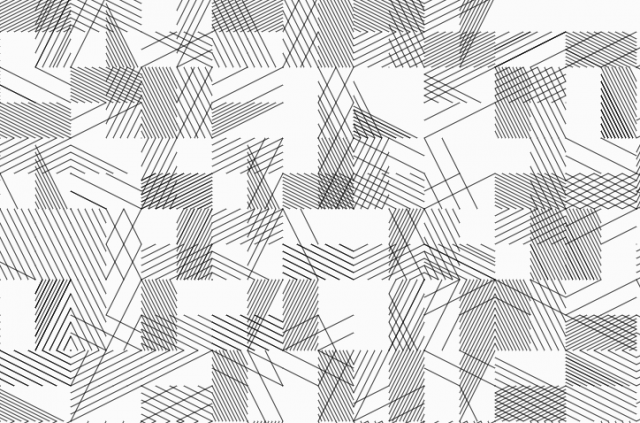
  1. the piece is composed mostly of diagonals across rectangles
  2. the rectangles are 1:2
  3. there are no squares
  4. most diagonal sections are parallel lines spaced equally apart
  5. here are some exceptions
    1. (I was lazy and did not implement these)
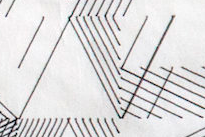
  6. As seen in image one the middle line is thicker than the neighbouring ones in part probably due to rounding errors
  7. Some of the diagonals across rectangles fill up to the half the space
  8. the space between the lines selected per rectangle
  9. The code was potentially run twice as the rectangles overlap
  10. there are multiple orientations for the lines. They either run left top to right bottom or right top corner to left bottom corner

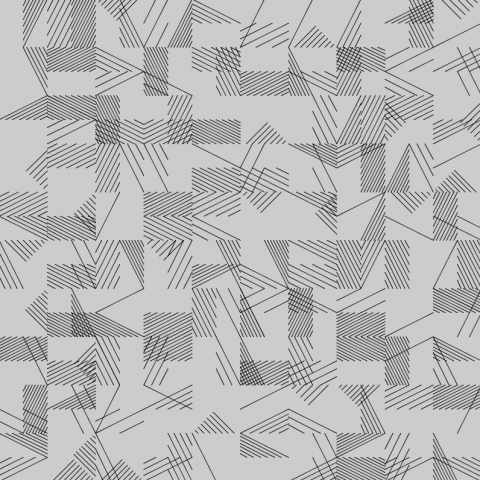
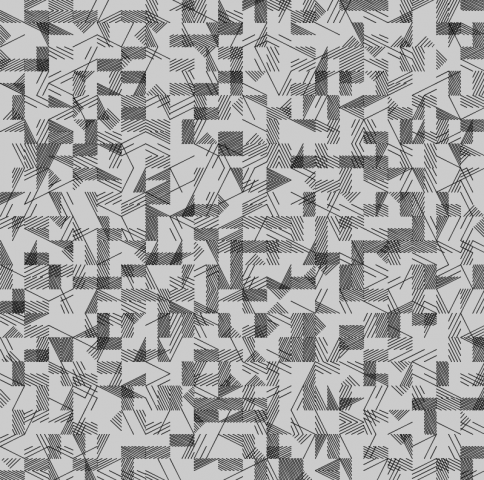
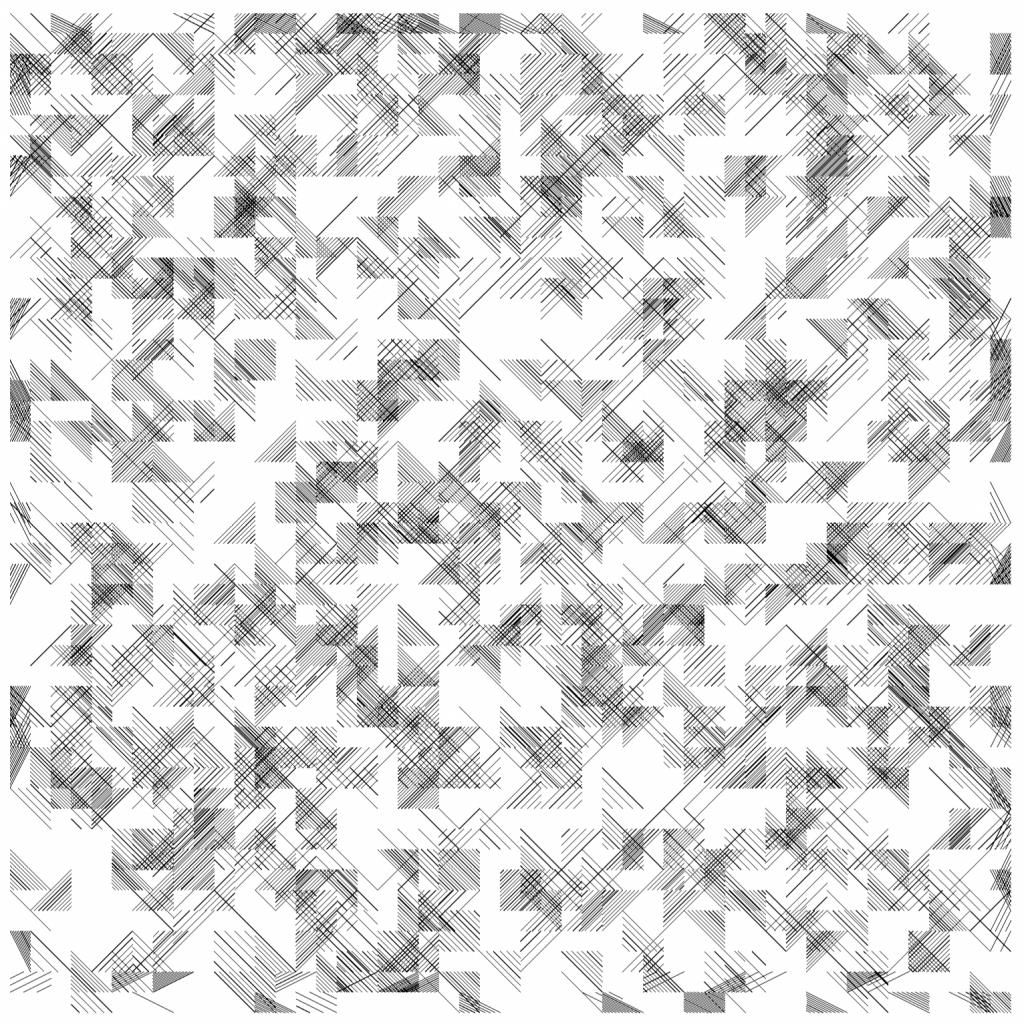
here’s what I generated

My work I feel is sort of close to the artists. However, I didn’t implement those small exceptions because I was lazy and tired. This work was hard to make because it took me a while just to generate the individual component of a random rectangle section and on top of that the math to produce the diagonals within it. Easily took me 5 hours because of that.

My code

https://editor.p5js.org/miniverse/sketches/gV2HWWueA

/* export SVG
DDF 2019
need to have p5.svg.js in project and in index.html
see -https://github.com/zenozeng/p5.js-svg
this will save an SVG file in your download folder
*/

function setup() {
  createCanvas(800, 800, SVG);
  strokeWeight(1); // do 0.1 for laser
  stroke(0, 0, 0); // red is good for laser
  nSquares = 20;
  strokeWeight(0.4)
  noFill(); // better not to have a fill for laser
}


function distance(x1, y1, x2, y2){
  return (y1 - y2)*(y1 - y2) + (x1 - x2)*(x1 - x2)
}

function fillSquare(squareW, startX,startY,  box1, box2, percentOptions){
  orientation = random([0, 1])
  percent = random(percentOptions)
  threshold = squareW * 7 * percent;
  if(orientation){
    point1 = [(box1[0] * squareW) + startX, (box1[1] * squareW) +startY]
    point2 = [(box2[0] * squareW) + startX, (box2[1] * squareW) +startY]
    
    spacingX = abs(point1[0] - point2[0]) * percent;
    spacingY = abs(point1[1] - point2[1]) * percent;
    if(random() < 0.7){ while(distance(point1[0], point1[1], point2[0], point2[1]) > threshold ){
        line( point1[0], point1[1], point2[0], point2[1]);
        point1 = [point1[0] + spacingX, point1[1]]
        point2 = [point2[0], point2[1] - spacingY]
      }
    }
    point1 = [(box1[0] * squareW) + startX, (box1[1] * squareW) +startY]
    point2 = [(box2[0] * squareW) + startX, (box2[1] * squareW) +startY]
    if(random() < 0.9){ while(distance(point1[0], point1[1], point2[0], point2[1]) > threshold ){
        point1 = [point1[0], point1[1] + spacingY]
        point2 = [point2[0] - spacingX, point2[1]]
        line( point1[0], point1[1], point2[0], point2[1]);
      }
    }
    return;
  }
  
  point1 = [(box2[0] * squareW) + startX, (box1[1] * squareW) +startY]
  point2 = [(box1[0] * squareW) + startX, (box2[1] * squareW) +startY]
  
  spacingX = abs(point1[0] - point2[0]) * percent;
  spacingY = abs(point1[1] - point2[1]) * percent;

  while(distance(point1[0], point1[1], point2[0], point2[1]) > threshold ){
    line( point1[0], point1[1], point2[0], point2[1]);
    point1 = [point1[0] - spacingX, point1[1]]
    point2 = [point2[0], point2[1] - spacingY]

  }
  point1 = [(box2[0] * squareW) + startX, (box1[1] * squareW) +startY]
  point2 = [(box1[0] * squareW) + startX, (box2[1] * squareW) +startY]
  if(random() < 0.7){ while(distance(point1[0], point1[1], point2[0], point2[1]) > threshold ){
      
      point1 = [point1[0], point1[1] + spacingY]
      point2 = [point2[0] + spacingX, point2[1]]
      line( point1[0], point1[1], point2[0], point2[1]);
    }
  }
}
function makeGrid(percentOptions){
  squareW = width / nSquares;
  for (var r = 0; r < nSquares; r++ ) {
    for (var c = 0; c < nSquares; c++) {
      box1 = random([[0, 0.0, 0.0], [1, 0.5, 0.0], [2, 0, 0.5]])
      if(box1[0] == 0){
        box2 = random([[ 1.0, 0.5], [0.5, 1.0]])
      }
      if(box1[0] == 1 || box1[0] == 2){
        box2 = [1.0, 1.0]
      }
      box1 = [box1[1], box1[2]]
      fillSquare(squareW, r * squareW, c * squareW, box1, box2, percentOptions);
    }
  }
}
function draw() {
  makeGrid([0.1, 0.2, 0.5]);
  makeGrid([0.1, 0.2, 0.5]);
  makeGrid([ 0.2, 0.5]);
  save("mySVG.svg"); // give file name
  print("saved svg");
  noLoop(); // we just want to export once
}

aahdee – MolnarRecode

Observations:

  1. The artwork seems to consist of a mixture of square and rectangular cells, but at closer inspection it is composed of square cells with subdivisions.
  2. Each square cell has one or two rectangular subdivisions that are hatched with lines.
  3. The subdivisions are chosen out of a pool of 4 – top, bottom, left, or right. There is no restriction on which subdivisions can be paired with each other – some have top and bottom, right and bottom, top and left, etc.
  4. Most cells have two subdivisions, only a select few have one.
  5. Sometimes a subdivision has two different patterns in it.
  6. The patterns use the same pen weight throughout the print.
  7. On rare occasions the subdivision rule is broken for the following pattern:
  8. The aforementioned pattern breaks the subdivision and cells rule. It bleeds into neighboring cells.
  9. Occasionally, a cell will generate a diagonal line that starts at a corner and ends at a midpoint of an opposing wall or the opposing corner.
  10. Because of the aforementioned rule, some diagonal lines that bisect a subdivision appear to be thicker that others. This is because they are drawn twice in the same place by the plotter. Below is a good example of this:

Recreation

SVG:

Screenshot:

I got a bit too invested in this task. It took me about 3 hours of work in Processing and I definitely got pretty close. The most difficult part was creating the triangle line pattern and reversing it for more variety in my output. I was going to recreate the pattern mentioned in observation 7 but I had gassed out at that point. My code is below the read more.

Continue reading “aahdee – MolnarRecode”

miniverse – PlotterTwitter

On plotter twitter I mainly saw geometric patterns and drawings with an element of optical illusion. I also saw limited color selection and  uniform thickness pens. Interesting techniques I saw was the use of flat tip pens to achieve variable thickness strokes in the same svg line. Makes me wonder if stylus rotation is controllable on plotters. As marimonda and aasdee mentioned, another beautiful technique an artist used was to make a water color plot painting by creatively structuring the svg file to dip the brush in a palette.

This artist uses a flat nib pens to create visual illusions. It looks like they redraw the same SVG file with two flat nib pens. However, in the second drawing they orient the pen in the plotter such that it produces thick lines where the first pen was thin and vice versa. This layers the ink in illusiony ways

Another technically interesting piece by the same artist.

grape – PlotterTwitter

Before viewing PlotterTwitter, I expected to see primarily abstract drawings with (varying) line detail. In my head that made sense because it showcases exactly what a human CAN’T do + maybe it’s easier to code abstract stuff at the beginning.

While I did end up seeing a lot of abstract drawings, what caught me off guard wasn’t the occasional representational drawing but rather the technique and amount of detail captured in the closeups of some of these tweets. I don’t know why but this tweet and this tweet are so hypnotizing because of the combination of moire + color.

Like others’ PlotterTwitter posts, I also found the watercolor technique used in this tweet to be fascinating – I’m interested in seeing how changing the frequency of water breaks for the paintbrush changes the texture and look of the final drawing.

I liked this one particular experiment by @Sheltron3030 on Twitter (Sheltron) because it got me thinking about how you replicate the stroke weight and texture found in calligraphy on an axidraw – I want to see an axidraw write some completely unintelligible cursive script. 🙂

lemonbear-PlotterTwitter

Going on Plotter Twitter was super interesting! There’s like a very unique sense of rhythm/repetition/texture inherent to the machine/medium that I hadn’t seen before in any other kind of artwork. I liked the ways people played with illusion, like overlapping primary colors to suggest other colors, and creating drawings with so many straight lines that there were implied curved forms (or so many ordered circles that there were implied straight forms). I think in a way most computing is really about illusion—the pixel matrix is not a continuous space, and floating point numbers render all decimals to the nearest approximation they can hold. It’s all about encoding information in the best way we can. Plotting these computed artworks felt really fun to me because these people were taking discrete, encoded approximations and shoving them back into a space with uncountably infinite possibilities (i.e. the blank page).

((Although, I would also have liked to see more attempts at generative objective artwork, like Lingdong’s fish. ))

This was one of my favorites from the tag. I just really enjoyed the interplay between the meticulously programmed artwork and the messiness of the watercolor. I loved the gradients that arose when different colors met and were still wet, and I liked the scratchiness of the white lines formed by the negative space between blocks.

bookooBread – PlotterTwitter

Before this assignment, I had never been on plotter twitter. And wow was I really missing out because there is some crazy, crazy stuff. The diversity in what people can people can make with this one tool is pretty insane. I feel like personally it offers some stylistic choices that I felt like I was missing from programming art. I love the imperfections and unexpectedness of using physical materials, so seeing how people can combine that with algorithms and code that also offer some unexpected (or expected) outcomes is really exciting.

I felt like this approach to blending color was super interesting and really taking advantage of what the plotter can do.

I was really drawn to the plotter work of @Sheltron3030. I think one thing that I was drawn to was his use of 3D in the 2D space of the paper. Using the plotter he was able to get such incredible depth that would be pretty difficult to do by hand. I also really loved the small distortions/gaps in each plot. It added this uniqueness and character that otherwise wouldn’t be as interesting without these “mess-ups”. Some of his plots also remind me of the look of screen printing? I’m not sure if it is the material/pen he used or just the mark being made, but I love it. Especially the ones with white pen on black paper. Kind of looks like the cover of unknown pleasures…?

aahdee – PlotterTwitter

I’ve engaged with #PlotterTwitter before – I have an axidraw and I unfortunately use Twitter. I really admire Michelle Chandra and Frederik Vanhoutte’s prints. The geometric repetition of their prints appeal to me.

I was pleasantly surprised to see a lot of interdisciplinary work with plotters and odd applications of plotters on PlotterTwitter. For example, one user posted a video of two axidraws painting in watercolor. The svg files for those plots must be daunting to look at.

I admired the use of multiple different pen thicknesses to enhance different prints, but pens that have a round nib tend to be the standard. I’d like to see what a print from a chiseled pen or marker would look like. I also want to see prints that challenge the purpose of a plotter. Instead of thinking of it as a robotic arm that draws, one can view it as a guide or an arm that can pick up, hold, move, or stab things. There’s this minigame from Rhythm Heaven, a rhythm game I use to play in my childhood, where you control a hand wielding a fork and your goal is to stab food that is flicked to you across the table. For some reason, I wish for an axidraw to do that.

The post that I appreciated the most involves a collaboration of a photographer and a plottermeister (using “plotter” for someone who uses a plotter to generate art doesn’t seem right, but “plottermeister” has a nice ring to it).

I like that this project clashes nature’s randomness with digital precision. It’s a good juxtaposition.


marimonda – PlotterTwitter

I have stumbled into PlotterTwitter before and I have always appreciated the variety of creative minds that it brings together. One of the things I appreciate the most about it is the general gravitation towards the abstract, and fundamentally in creating drawings or art that are not easily replicable by human beings. This comes in the form of highly intricate patterns or works that rely on precise curves that can’t be easily replicated through real-life tools. However I also appreciate it when the converse happens, and there is legitimate experimentation with media, to the point of replicating versatile and messy techniques like watercolors.

Licia He makes incredible art that does this, and I think for me this was one of the most fascinating pieces of plotter art that I saw, in large part because I couldn’t believe it was generative.

One of the other themes I appreciated the most was this idea of copying and replicated biological structures and patterns into physical objects.  I came across this wonderful piece by @josephwilk that highlighted this.

sweetcorn – MolnarRecode

Assertions
1. The artwork is square
2. A grid of axis-aligned squares underlies the artwork
3. A rectangle can be created out of multiple squares
4. The squares used to create rectangles can be shared
5. Each rectangle can either be shaded, unshaded, or half-shaded along a diagonal
6. If a rectangle is half-shaded, its other half is unshaded
7. Equally spaced lines parallel to one of the rectangle’s 2 diagonals create shading
8. The strokes are all of uniform weight and color
9. The number of lines per rectangle is variable
10. There are more shaded squares than unshaded squares

I’m not sure what it is exactly, but my recreation doesn’t have the same simplicity and elegance as Molnár’s. I think I allow too much overlap, which makes the final a bit too busy. Molnár has only a touch of overlap which isn’t too distracting. It was fun trying to imagine the underlying structure of Molnár’s work, and to imagine the possibilities of future artwork with similar underlying structures as well.

var numEdges = 50;

function setup() {
     createCanvas(816, 816, SVG).position((windowWidth-width)/2, (windowHeight-height)/2);

     noSmooth();
     noFill();
     stroke(0);

     var squares= [];
     for(i=0; i<numEdges; i++){
          for(j=0; j<numEdges; j++){
               squares.push(new structure_square(i, j));
          }
     }

     save("plot.svg");
}

class structure_square {
     constructor(i, j) {
          self.index_x=i;
          self.index_y=j;
          var spread_max=1;
          var spread_n=ceil(random(spread_max));
          var spread_s=ceil(random(spread_max));
          var spread_e=ceil(random(spread_max));
          var spread_w=ceil(random(spread_max));

          if(j==0){
               spread_n=0;
          } else if(j == numEdges-1){
               spread_s=0;
          }

         if(i==0){
               spread_e=0;
         } else if(i == numEdges-1){
               spread_w=0;
         }

         newstructure_rectangle(i-spread_e, j-spread_n, i+spread_w, j+spread_s);
     }
}

class structure_rectangle {
     constructor(i_0, j_0, i_1, j_1) {
         let rect_w= (i_1-i_0) *width/numEdges;
         let rect_h= (j_1-j_0) *width/numEdges;
         let x_0=i_0*width/numEdges;
         let y_0=j_0*width/numEdges;

         stroke(0);
         strokeWeight(0.5);

         let max_shade_lines=12;
         let num_shade_lines=ceil(random(max_shade_lines));
         let h_space=rect_w/num_shade_lines;
         let v_space=rect_h/num_shade_lines;

         if(random() <0.5){
              if(random() <0.25) {
                   for(varline_num=0; line_num<num_shade_lines; line_num++) {
                        line(x_0+line_num*h_space, y_0, x_0+rect_w, y_0+rect_h-line_num*v_space);
                   }
              }
         if(random() <0.25) {
              for(varline_num=0; line_num<num_shade_lines; line_num++){
                   line(x_0, y_0+line_num*v_space, x_0+rect_w-line_num*h_space, y_0+rect_h);
              }
         }
       } else {
         if(random() <0.25) {
              for(varline_num=0; line_num<num_shade_lines; line_num++){
                   line(x_0+line_num*h_space, y_0, x_0+rect_w, y_0-rect_h+line_num*v_space);
              }
         }
         if(random() <0.25) {
              for(varline_num=0; line_num<num_shade_lines; line_num++){
                   line(x_0, y_0-line_num*v_space, x_0+rect_w-line_num*h_space, y_0-rect_h);
              }
         }
       }
     }
}