![[OLD FALL 2018] 15-104 • Introduction to Computing for Creative Practice](https://courses.ideate.cmu.edu/15-104/f2018/wp-content/uploads/2020/08/stop-banner.png)
Chris Harrison’s Bible Cross-References Visualization Project
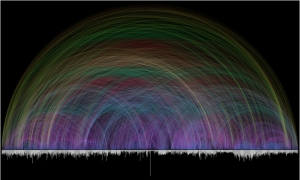
The computational information visualization project I chose was Chris Harrison’s Bible Cross-References. Chris worked with a Lutheran pastor to create a visualization of biblical data regarding textual cross references. At first, they wanted to create an interactive visualization that people could zoom in on and learn from but then they realized that a lot of other projects/programs existed for that purpose. As a result, their focus was just on the creative, beautiful visualization of the data. They wanted to capture the complexity of the data and honor the immensity of the textual cross references in the Bible. So, they came up with the visualization above. The colors represent the distance between two chapters from the cross reference and it creates a beautiful rainbow-like figure. There are so many different colored lines, 63,779 to be exact, that shows exactly what Chris wanted to show through this information visualization which was the complexity and immensity of the biblical data. I really admire this project because when I think of design, I focus on making effectiveness or efficiency and not just beauty. This project however really emphasizes the beauty of the data and focuses on a very simple yet important goal. It shows me that design can just be an aesthetic that I can admire and enjoy for visual pleasure.