CJ Walsh – Project 07 – Composition with Curves

sketch

// CJ Walsh 
// Section D
// cjwalsh@andrew.cmu.edu
// Project 07
 
function setup() {
    createCanvas(480, 480);
    cx = width/2;
    cy = height/2;
    // list of colors for my larger lines 
    c1 = ['green', 'teal', 'cornflowerblue', 'royalblue', 'darkslateblue', 'navy'];
}
 
 
function draw() {
    background("lightcyan");
    h = cx;
    w = cy;
    s = PI/8;
    noFill();
    mx = constrain(mouseX, 0, cx);
    my = constrain(mouseY, 0, cy);
    // loop to establish all of the curves I draw 
    for (i = 0; i <= 2*PI; i+=s) {
        // thin orchid lines
         for (k = 0; k < 5; k++) {
            push();
                strokeWeight(1);
                stroke('orchid');
                translate(cx, cy);
                rotate(i);
                ellipse(mx - 30 - 10*k, my - 30 - 10*k, 120, 120);
            pop();
        }
        // larger blue/green lines
        for (j = 0; j < 12; j++) {
            push();
                strokeWeight(3);
                stroke(c1[j%6]);
                translate(cx, cy);
                rotate(i);
                ellipse(mx + 4*j, my + 4*j, 3*mouseX/2, 3*mouseY/2);
            pop();
        }
        // small black dots
        for (l = 0; l < 30; l++) {
            push();
                strokeWeight(2);
                stroke('black');
                translate(cx, cy);
                rotate(i);
                ellipse(mx - 60*l, my - 60*l, 5, 5);
            pop();
        }

    }    
}
 

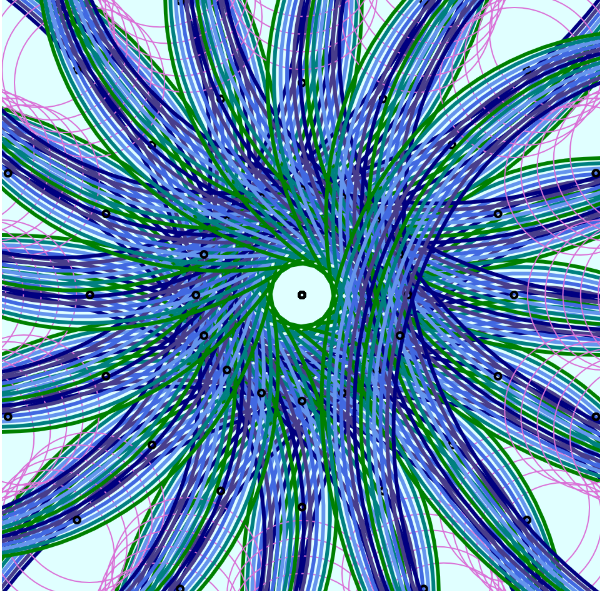
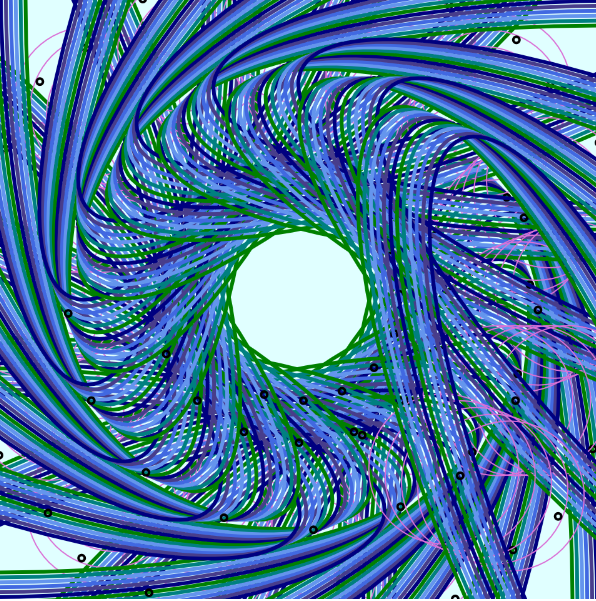
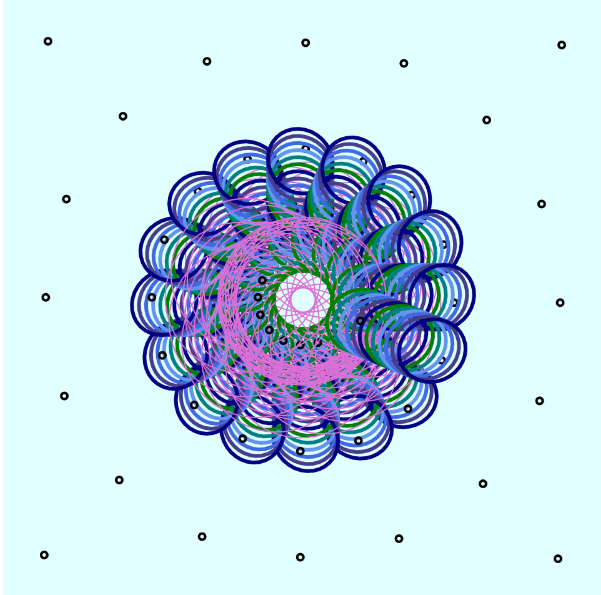
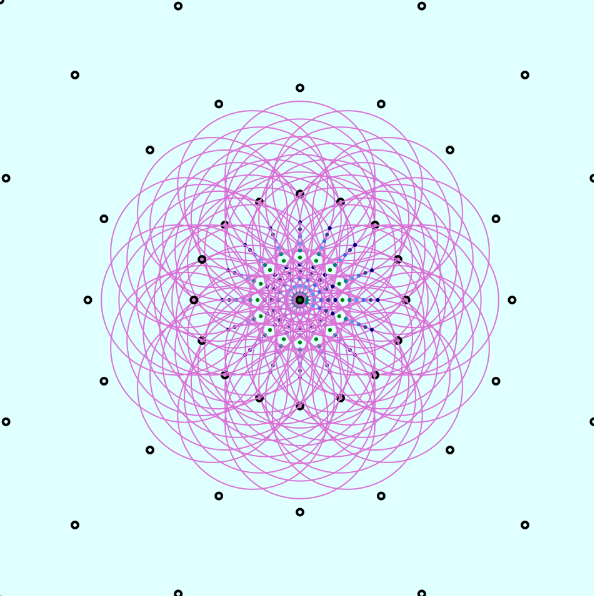
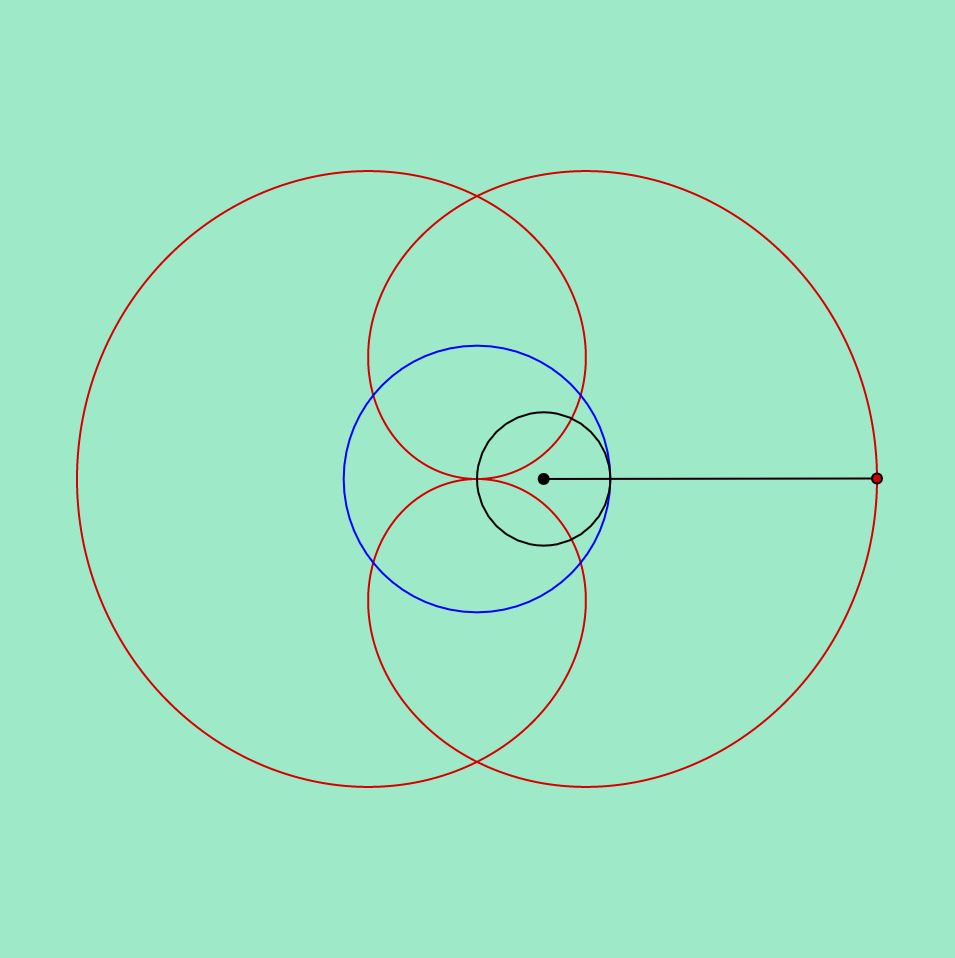
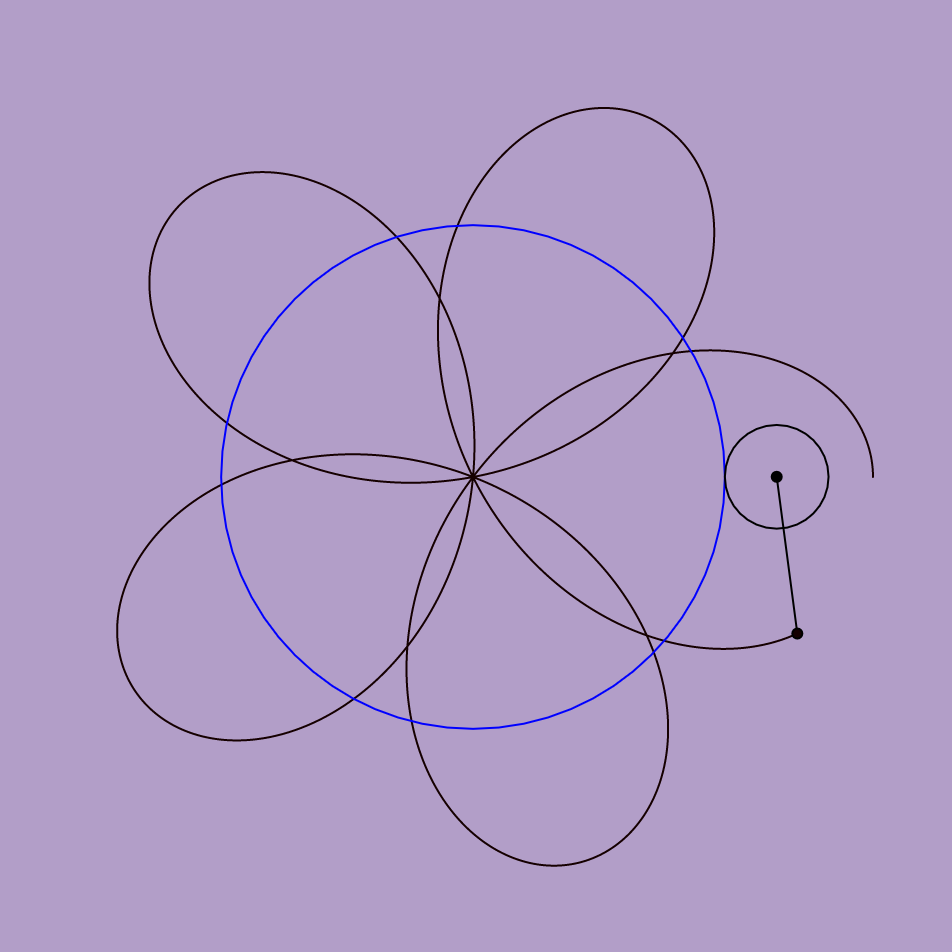
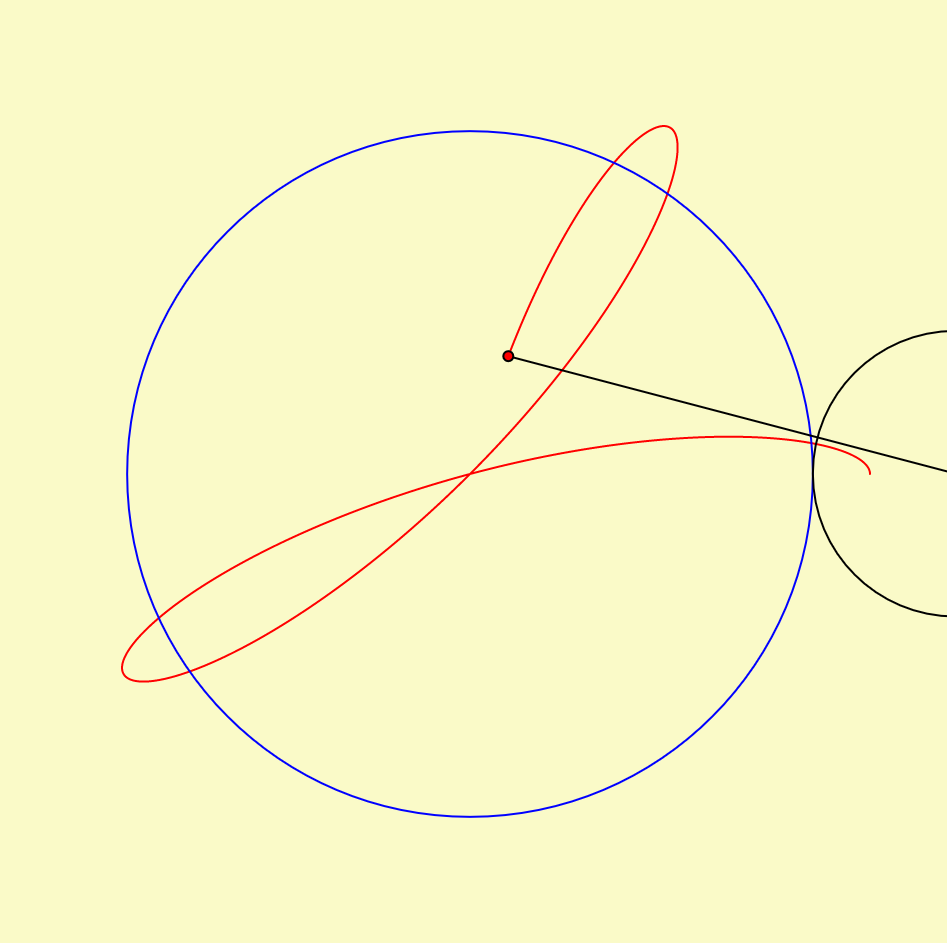
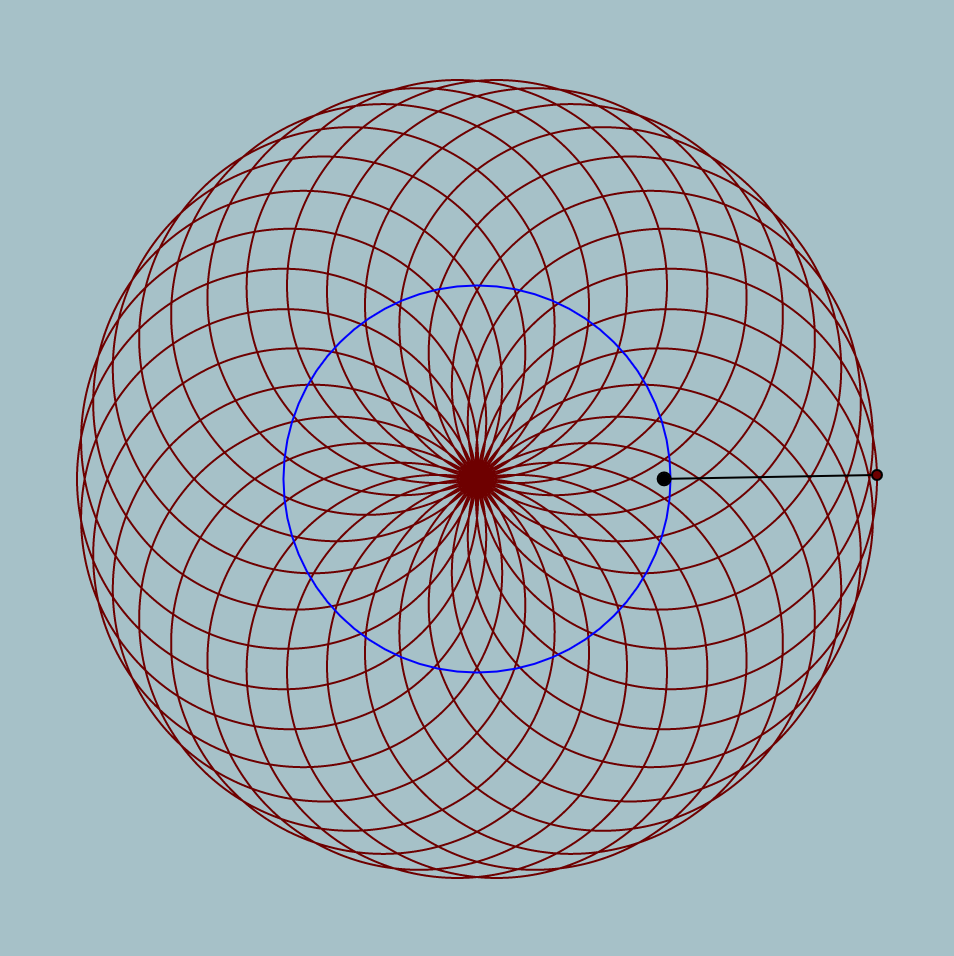
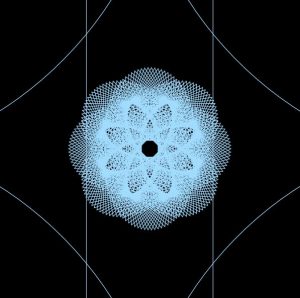
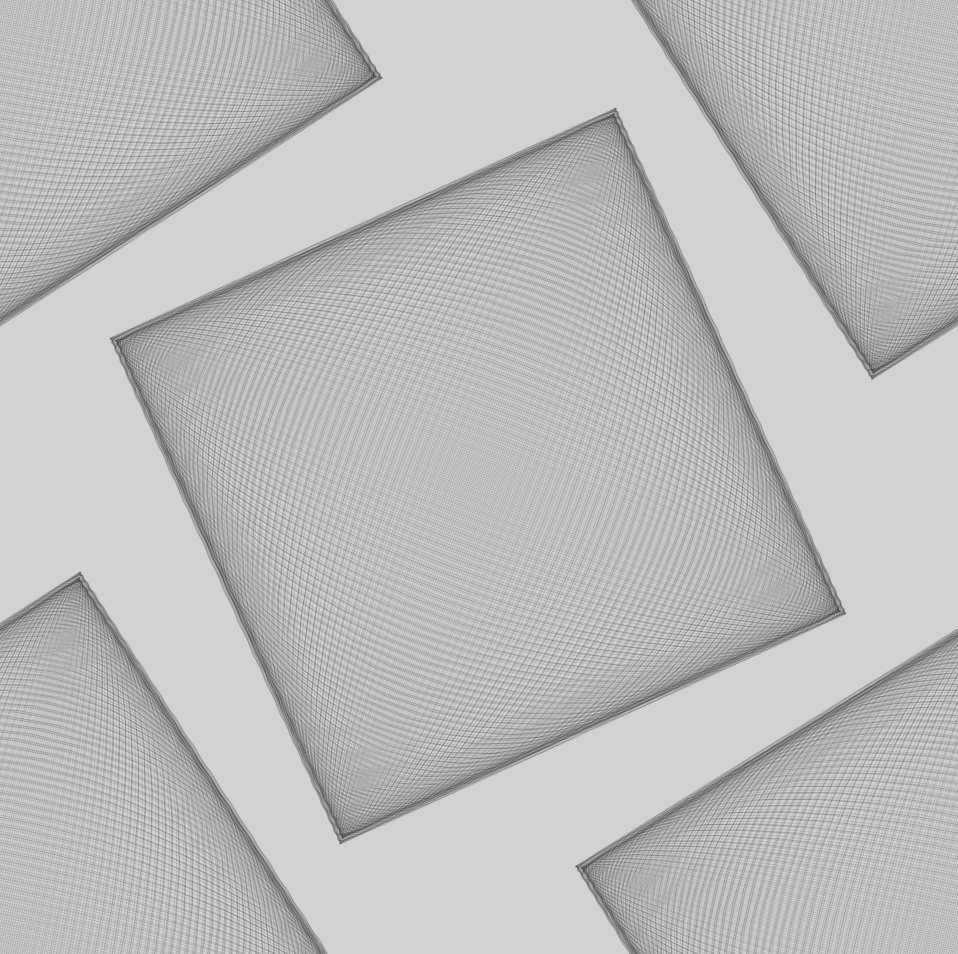
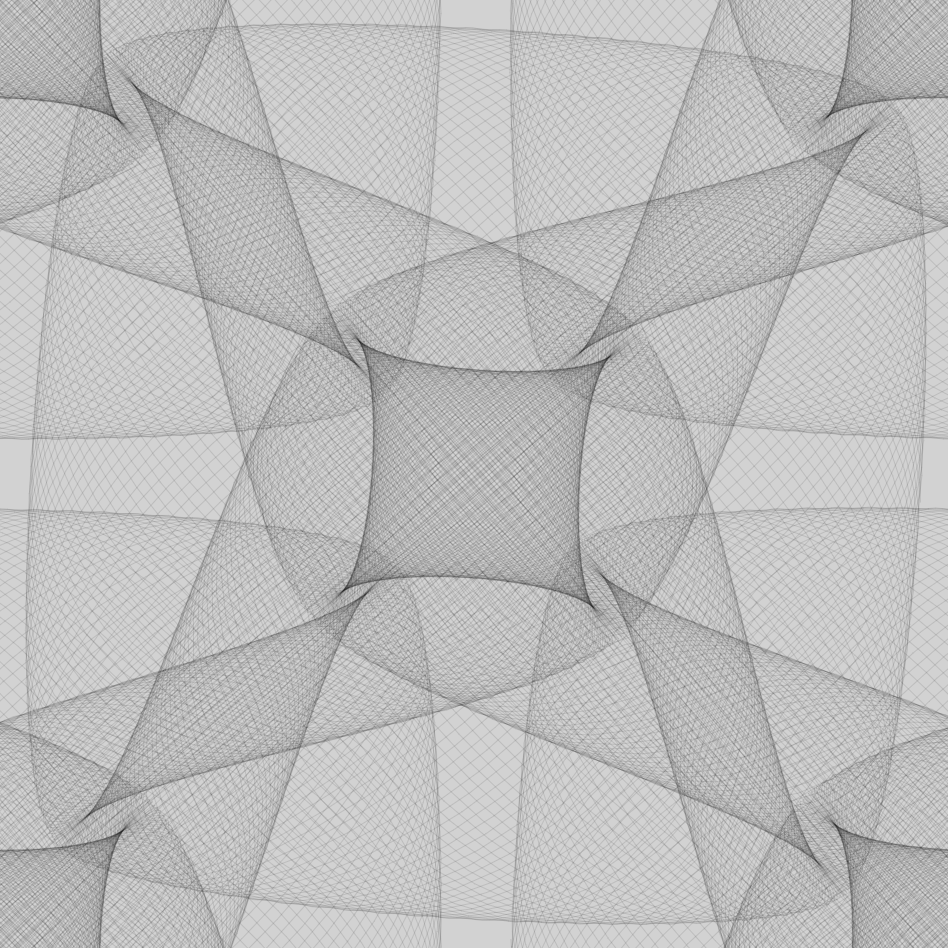
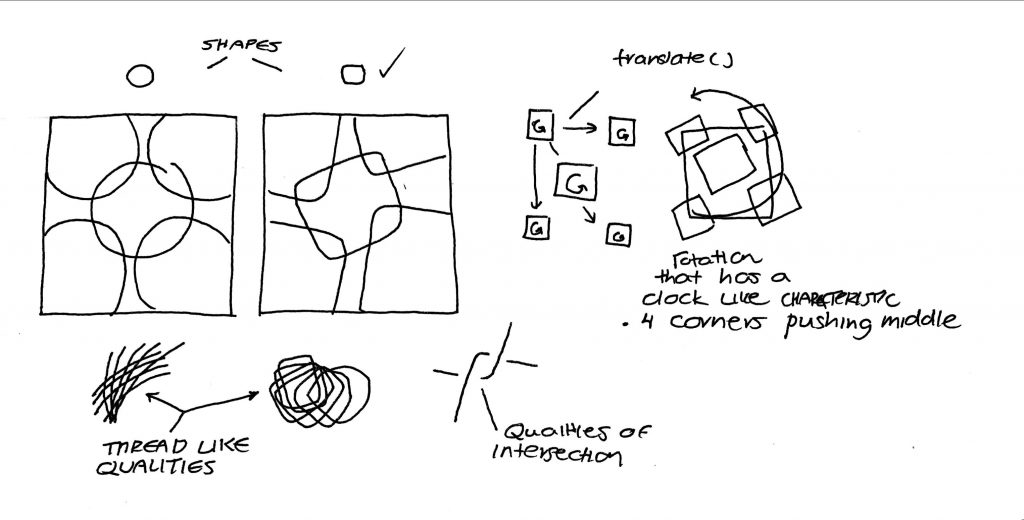
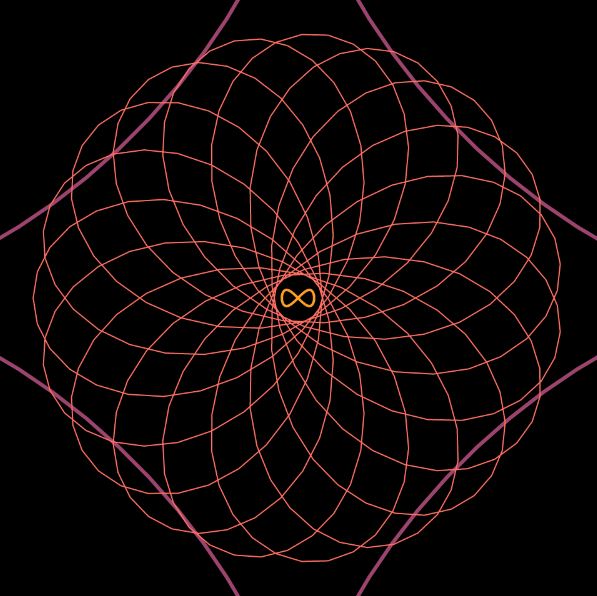
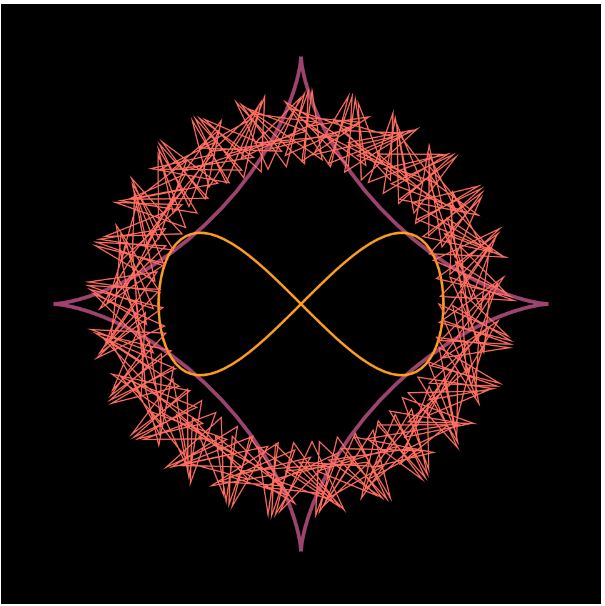
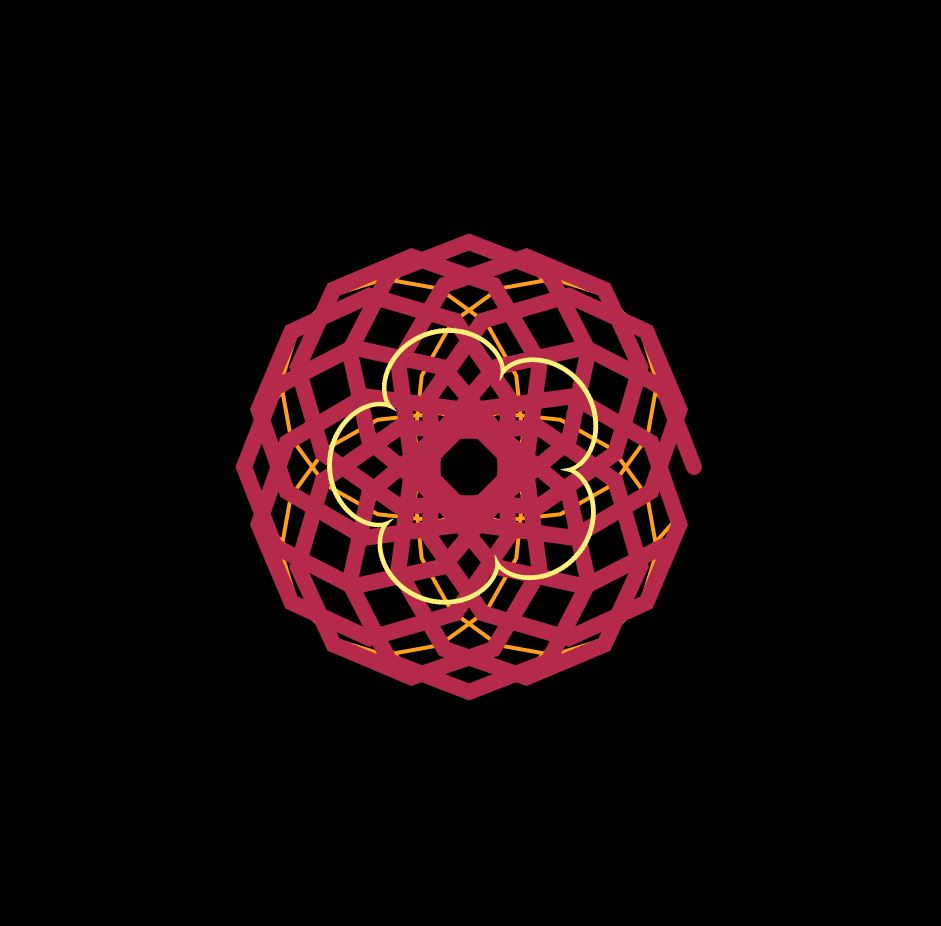
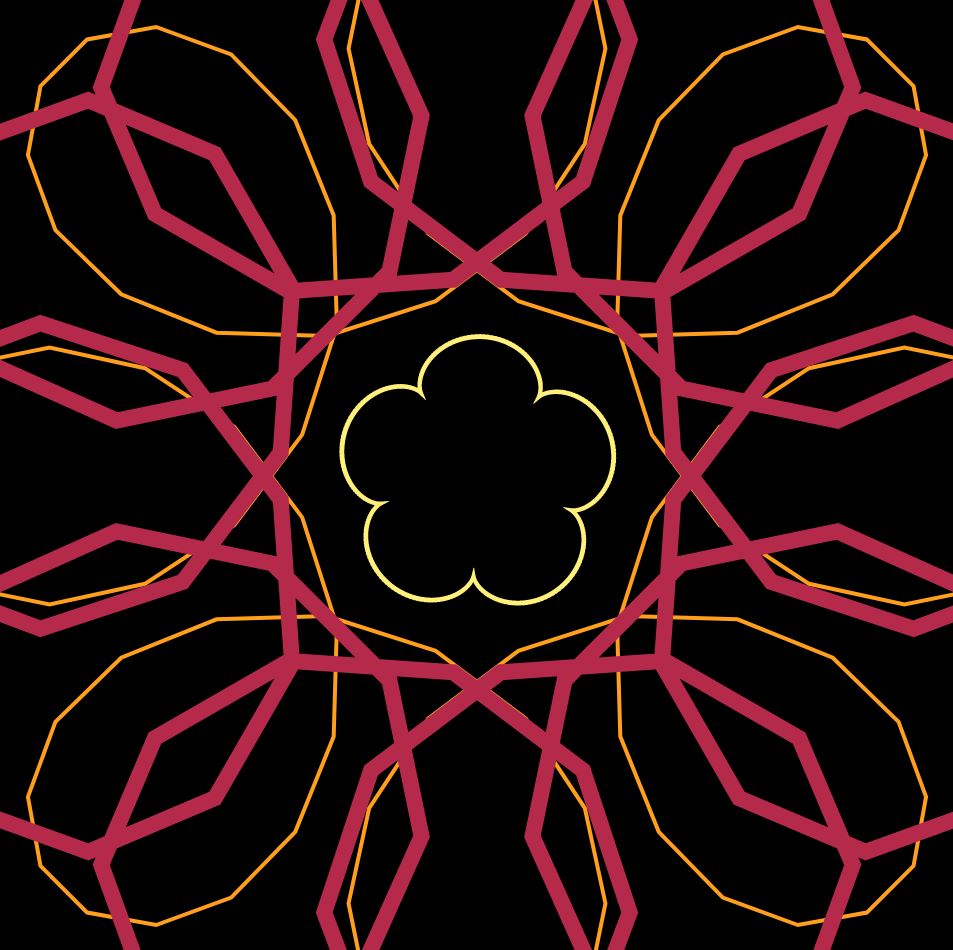
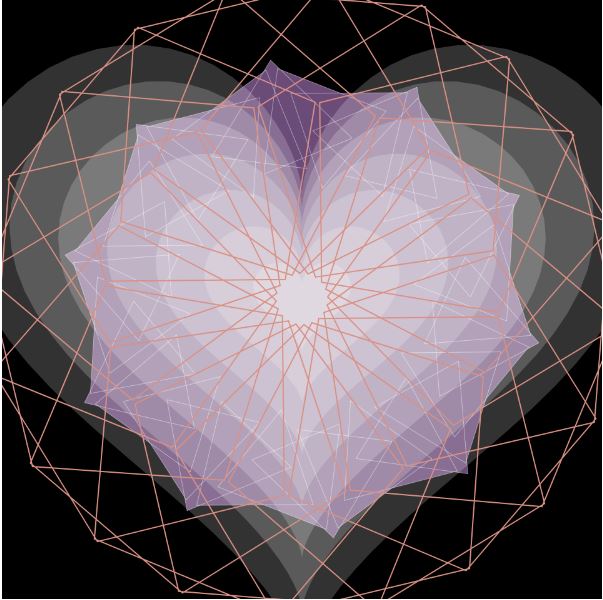
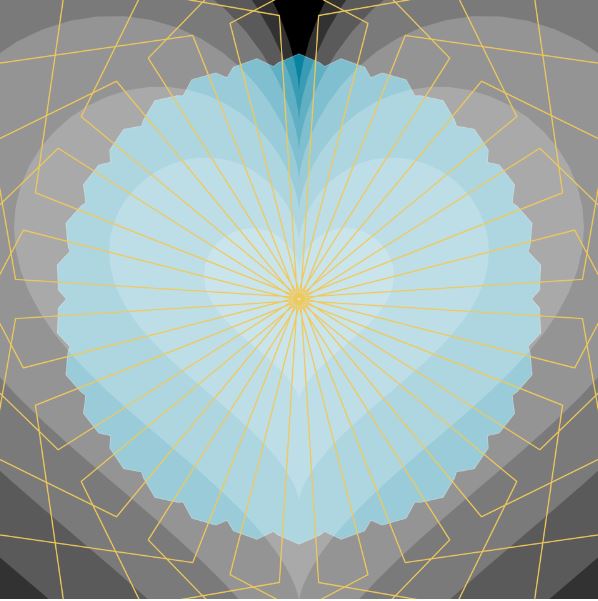
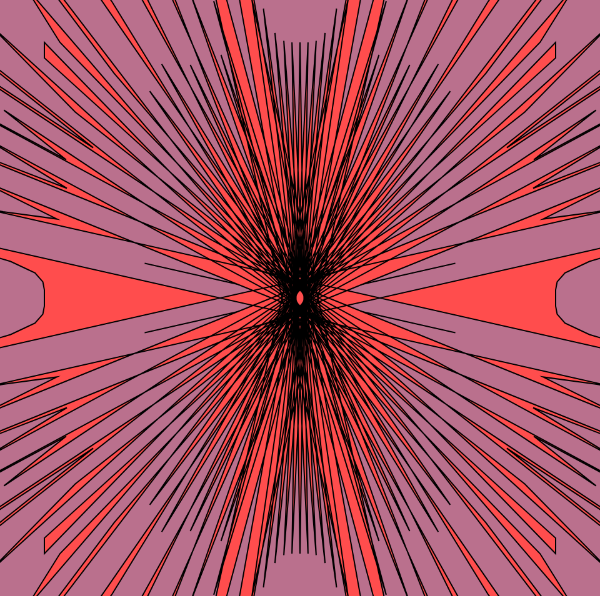
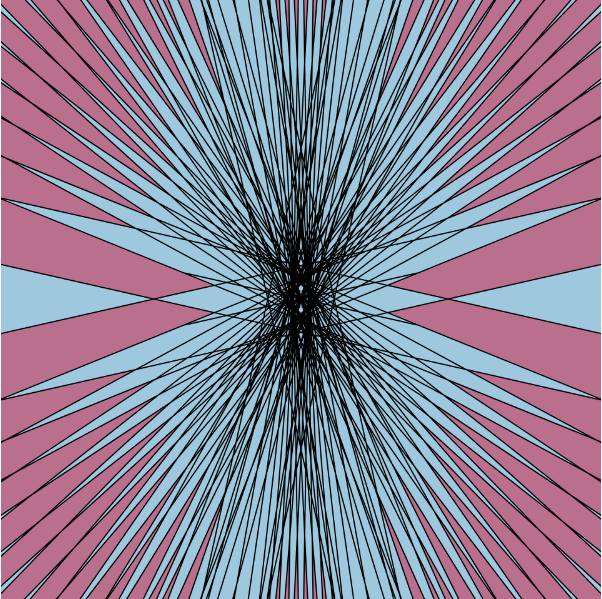
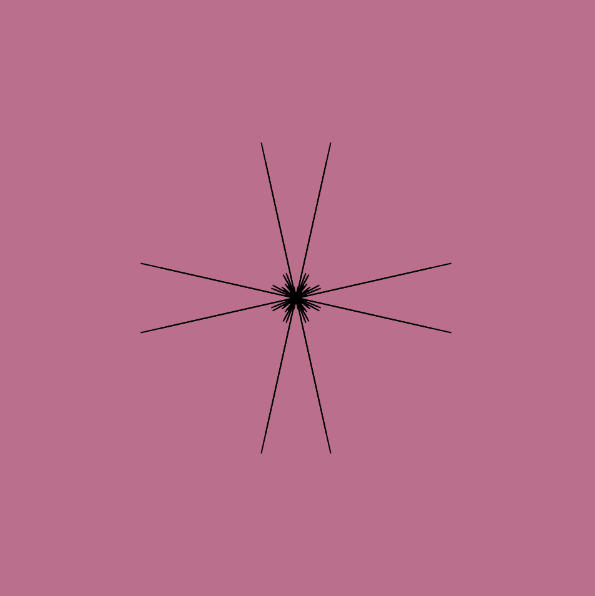
This was a super fun project to make in terms of experimenting with curves and loops. I started out by setting up an initial for loop and just drawing one curve. From there, I established some more loops to duplicate lines, or played around with some of the numbers so that I could create different shapes. This is another project that I could definitely see myself playing with or changing in the future because it was so fun to make. Below I included some of my favorite screenshots of the composition as it moves around.

Ghalya Alsanea – Project-07-Curves

sketch

//Ghalya Alsanea
//Section B
//galsanea@andrew.cmu.edu
//project-07

var outR;               //outer circle radius
var inR;                //inner circle radius
var d = 100;            //distance for drawing pedal 
var t;                  //theta variable
var points = 10000;     //number of points to draw in for loop
var color2;             //global color variable

//constrained mouse values
var MX;
var MY;
//x and y values for resulting curve
var x;
var y;

function setup() {
    createCanvas(480, 480);
}

function draw() {
    //constrain mouse x and y within the canvas
    MX = constrain(mouseX, 0, width);
    MY = constrain(mouseY, 0, height);

    //map background color based on mouse location
    var color0 = map(MX, 0, width, 150, 250);
    var color1 = map(MY, 0, height, 150, 250);
    background(color0, color1, 200);

    //mapped color value based on mouse y location
    color2 = map(MY, 0, height, 0, 255);

    //draw everything using the center of canvas as (0,0)
    translate(width/2, height/2);
    //map the driving circle dimensions to mous x pos
    n = map(MX, 0, width, 0, 6)
    //rose formula for the radii
    outR = (2*n*d)/(n+1);
    inR = (n-1)*d/(n+1);

    drawHypotrochoid();
    drawBaseCrvs();
}

function drawHypotrochoid() {
    noFill();
    //map color value to mouse y location
    stroke(color2, 0, 0);

    //draw the resulting curve
    beginShape();
    for (var i = 0; i < points; i++) {
        // map theta to full circle radians
        t = map(i, 0, points, 0, TWO_PI);
        //use the mathematical formula of a Hypotrochoid to find x and y values
        x = (outR - inR) * cos(t) + d * cos((outR-inR) / inR * t);
        y = (outR - inR) * sin(t) - d * sin((outR-inR) / inR * t);
        vertex(x, y);
    }
    endShape();

}

function drawBaseCrvs() {
    //draw outer circle
    stroke(0, 0, 255);
    noFill();
    ellipse(0, 0, 2*outR, 2*outR);

    //draw the inner circle and line 
    stroke(0);
    fill(0);
    ellipse((outR+inR) * cos(t), (outR+inR) * sin(t), 5, 5);
    line((outR+inR) * cos(t), (outR+inR) * sin(t), x, y);
    noFill();
    ellipse((outR+inR) * cos(t), (outR+inR) * sin(t), 2 * inR, 2 * inR);

    //draw pedal dot
    fill(color2, 0, 0);
    ellipse(x, y, 5, 5);
}

Inspired by the rose variation of a hypotrochoid on Wolfram’s Math World, I tried to show the logic behind how the hypotrochoid curves are drawn as well. In terms of color, the background and the resulting curve’s stroke color change with the mouse location. To add an extra level of interaction, the “n” variable also reacts to the mouse location, which controls the radii of the two circles that create the hypotrochoid, resulting in the manipulation of the resulting overall shape.

Xiaoyu Kang – Project 07 – Curves


sketch

//Xiaoyu Kang
//xkang@andrew.cmu.edu
//Section B
//Project-07

var angles = 0;
function setup() {
    createCanvas(480, 480);
}

function draw() {
    background(0);
    stroke(mouseX, 220, mouseY);
    translate(width / 2, height / 2);
    // all the curves rotate at the same speed
    rotate(radians(angles));
    angles += (mouseY/30);
    drawCruciform(); 
    drawAstroid();
    drawEpitrochoid();
}

function drawCruciform() {
    // http://mathworld.wolfram.com/Cruciform.html
    push();
    noFill();
    strokeWeight(1);

    
    //creates the cruciform
    beginShape();
    var a = map(mouseX, 0, width, 0, 300);
    var b = map(mouseY, 0, height, 0, 300);
       
    for (var i = 0; i < 800; i++) {
        var t = map(i, 0, 150, 0, TWO_PI);
        var x = a * 1 / (cos(t));
        var y = b * 1 / (sin(t));
        vertex(x, y);
    }
    endShape();
    pop();
}

function drawAstroid() {
    // http://mathworld.wolfram.com/Astroid.html
    push();
    noFill();
    strokeWeight(1);
    
    //draw astroid
    beginShape();
    var a = map(mouseX, 0, width, -300, 300);

    for (var i = 0; i < 500; i++) {
        var t = map(i, 0, 150, 0, TWO_PI);
        var x = 3 * a * cos(t) + a * cos(3 * t);
        var y = 3 * a * sin(t) - a * sin(3 * t);
        vertex(x, y); 
    }
    endShape();
    pop();
}

function drawEpitrochoid() {
    // http://mathworld.wolfram.com/Epitrochoid.html
    push();
    noFill();
    strokeWeight(1);
    
    //draw epitrochoid
    beginShape();
    var a = map(mouseX, 0, width, -100, 100);
    var b = map(mouseX, 0, width, -100, 200);
    var h = map(mouseY, 0, height, -300, 200);


    for (var i = 0; i < 600; i++) {
        var t = map(i, 0, 150, 0, TWO_PI);
        var x = (a + b) * cos(t) - h * cos(((a+b)/b) * t);
        var y = (a + b) * sin(t) - h * sin(((a+b)/b) * t);
        vertex(x, y); 
    }
    endShape();
    pop();
}

For this project, I really want to create curves that are diverse in shape as the mouse moves around. I picked three curves that are all very different in shape an as the mouse moves they turn into patterns with different level of complexity. Also to add some more visual elements, I changed the color setting so that as the mouse moves the color changes as well.

Yoshi Torralva-07-Curves

sketch

// Yoshi Torralva
// yrt@andrew.cmu.edu
// Section E
// Project-07-Curves

// rotation variable speeds
var angle = -1;
var angle1 = -1;
var angle2 = -1;
function setup() {
    createCanvas(480, 480);
}
function draw() {
    // calling five hypotrochoids 
    // from the same drawhypotrochoid function
    //upper left hypotrochoid
    background(210);
    push();
    rotate(angle2);
    angle2 = angle2 + 0.01;
    drawHypotrochoid();
    pop();
    //center hypotrochoid
    push();
    translate(width/2, height/2);
    rotate(angle1);
    angle1 = angle1 + 0.01;
    drawHypotrochoid();
    pop();
    //right hypotrochoid
    push();
    translate(480, 0);
    rotate(angle2);
    angle2 = angle2 + 0.01;
    drawHypotrochoid();
    pop();
    //bottom right hypotrochoid
    push();
    translate(480, 480);
    rotate(angle2);
    angle2 = angle2 - 0.02;
    drawHypotrochoid();
    pop();
    //bottom left hypotrochoid
    push();
    translate(0, 480);
    rotate(angle2);
    angle2 = angle2 - 0.02;
    drawHypotrochoid();
    pop();
}
// Hypotrochoid
function drawHypotrochoid(x, y) {
    //setting a, b, and h variables
    // radius
    a = map(mouseX, 0, width/6, 0, 50);
    // radius of rotating circle
    b = a / constrain(mouseY, 0, height);
    // starting height 
    h = 100;
    points = 10000;
    push();
    beginShape();
    translate(0, 0);
    noFill();
    // variables to create shifting greyscale
    // depending on mouseX and mouseY positions
    var limitto255 = mouseX - 500;
    var limitto255y = mouseY - 450;
    stroke(0 + limitto255, 255 - limitto255y);
    // for loop to create multiple lines up to 10000
    for(var i = 0; i < points; i++) {
        // constrains on mouseX and Y on variables
        a = constrain(mouseX, 0, width);
        b = constrain(a/mouseY, 0, width);
        h = constrain(mouseY, 0, height);
        var t = map(i, 0, points, 0, TWO_PI);
        x = (a - b) * cos(t) + h * cos(((a + b)/ b) * t);
        y = (a - b) * sin(t) - h * sin(((a - b)/ b) * t);
        // half of original size 
        strokeWeight(0.05);
        vertex(x/2,y/2);
    }
    endShape();
    pop();
}

Circles visible at the top part of the canvas.
Square forms when the mouse is as the left side of the canvas
Five hypotrochoid curves intersect creating a dynamic form.

With this project, I was inspired to emulate the qualities of fabric like tulle and mesh. Using these mathematical curves afforded the opportunity to explore this. I decided to use the hypotrochoid curve as it offered the ability to create overlapping curves like the Guilloché Pattern. Going beyond my inspiration for fabric, I wanted to convey the feelings of hardness and softness. When the mouse is moved to the right, the hypotrochoids turn into squares. When the mouse is moved to the left, the hypotrochoids take a dynamic shape. I implemented rotation to allow for interactive intersections and organic forms to come to life. I chose to make this project at a greyscale as I wanted the viewers to focus to be on the form. Variations on the greyscale are achieved through mouse positioning.

Claire Yoon-Project 7-Curves


sketch

For this project, I played  with how the different curve functions interacted and overlapped with each other. I made the rotation continuous to make it more visually dynamic.

Different forms:

/* Claire Yoon
   claireyo@andrew.cmu.edu
   Section E
   Project 7 */

// global variables
var nPoints = 200;
var angle = 0;
var rotateCount = 0
function setup() {
    createCanvas(480, 480);
    frameRate(20);
}

function draw() {
    background (255, 209, 224);
    // calling functions at middle of the canvas
    push();
    translate(width / 2, height / 2);
    // function continuously rotating 
    rotate(radians(rotateCount));
    rotateCount++;
    drawHypocycloid();
    drawHypotrochoid();
    pop();


}
function drawHypotrochoid() {
    //setting variables for pale pink hypotrichoid
    var a1 = map(mouseX, 0, 450, 50, 240);
    var b1 = 10;
    var h1 = map(mouseX / 10, 0, 200, 0, height);

    //pale pink stroke
    fill(255, 255, 255, 100);
    stroke(255, 209, 224);
    strokeWeight(1.5);
    // for loop to draw hypotrochoid form
    beginShape();
    for(var i = 0; i < nPoints; i++) {
        // angle for hypotrochoid formula
        var angle1 = map(i, 0, 100, 0, TWO_PI);
        x = (a1 - b1) * cos(angle1) + h1 *  cos(((a1 - b1)/ b1) * angle1);
        y = (a1 - b1) * sin(angle1) - h1 * sin(((a1 - b1)/ b1) * angle1);
        vertex(x, y);
    }
        endShape();
}

function drawHypocycloid() {
    // setting variables for white astroid
    a2 = int(map(mouseX, 0, width, 240, 150));
    b2 = int(map(mouseX, 0, width, 8, 15));
    // pale pink with low opacity
    fill(189, 236, 255, 40);
    stroke("white");
    strokeWeight(1);

    beginShape();
    // for loop to draw hypocycloid form
    for (var i = 0; i < 200; i++){
        // angle for hypocycloid formula
        var angle2 = map(i, 0, 100, 0, TWO_PI);
        var x = a2 * ((b2 - 1) * cos(angle2) + cos((b2 - 1) * angle2)) / b2;
        var y = a2 * ((b2 - 1) * sin(angle2) + sin((b2 - 1) * angle2)) / b2;
        vertex(x, y);
    }
    endShape();
}

Xu Xu – Project 07 – Curves

sketch

//Claire Xu
//xux1@andrew.cmu.edu
//Section B
//Project-07
var angle = 0;

function setup() {
    createCanvas(480, 480);
    frameRate(100);
}


function draw() {
    background("black");
    push();
    translate(width/2, height/2);
    rotate(radians(angle));
    angle += mouseX;
    drawAstroid();
    drawEightCurve();
    drawHypocycloid();
    pop();
}
function drawAstroid() {
    var b = map(mouseY, 0, width, -100, 150);
    strokeWeight(3);
    stroke(157,68,110);
    noFill();
    beginShape();
    for (var i = 0; i < 300; i++){
        var t = map(i, 0, 100, 0, TWO_PI);
        var x = (3*b*cos(t) + b*cos(3*t));
        var y = (3*b*sin(t) - b*sin(3*t));
        vertex(x, y);
    }
    endShape(CLOSE);

}
function drawEightCurve() {
    strokeWeight(2);
    stroke(252,158,33);
    noFill();
    var a = map(mouseX, 0, width, 0, 100); 
    beginShape();
    for (var i = 0; i < 800; i++){
        var t = map(i, 0, 100, 0, TWO_PI);
        var x = (a*sin(t));
        var y = (a*sin(t)*cos(t));
        vertex(x, y);
    }
    endShape(CLOSE);
}

function drawHypocycloid() {
    strokeWeight(1);
    stroke(255,111,97);
    noFill(); 
    var a = map(mouseX, 0, width, 0, 150);
    var b = map(mouseY, 0, width, 0, 150);
    beginShape();
    for(var i = 0; i < 400; i++){
        var angle2 = map(i, 0, 100, 0, TWO_PI);
        var x = ((a - b)* cos(angle2) - b*cos(((a - b))*angle2));
        var y = ((a - b)* sin(angle2) + b*sin(((a - b))*angle2));
        vertex(x, y);
    }
    endShape(CLOSE);
}

This project was quite challenging, because it took me a long time before I figured out what part of the code modified which part of the drawn form. I wanted to create spiraling geometric shapes that are web-like, and I was really interested in Hypocycloid, because it seemed to be less “restrictive” than other curves. I think the rotation makes it look more fun, because it gives the drawing a new dimension.

Stefanie Suk – Project 07 – Curves

sketch

//Stefanie Suk
//15-104 D
//ssuk@andrew.cmu.edu
//Project - 07 - Curves

var nPoints = 100;

function setup() {
    createCanvas(400, 400);
}


function draw() {

    fill(20, 8, 78); //color for background
    rect(0, 0, width, height); 
    
    push();
    translate(width / 1.4, height / 2);
    drawCurve();
    pop();

}

function drawCurve() {
    var cR = map(mouseX, 0, width, 100, 200);
    var cG = map(mouseX, 0, width, 200, 250);
    var cB = map(mouseX, 0, width, 230, 255); //color for shape

    var s = 100; // size
    var a = constrain(mouseX/2, 0, width) / 30; // mousex position
    var b = constrain(mouseY/2, 0, height) / 30; // mousey position

    fill(cR, cB, cG);
    strokeWeight(5);
    stroke(255);

    beginShape(); 
    for (var i = 0; i < nPoints; i++){ 
    var t = map(i, 0, nPoints, 0, TWO_PI); 

    x = s * (cos(a+t) * (1-(cos(a+t))));
    y = s * (sin(b+t) * (1-(cos(b+t)))); // equation of curve to create shape

    vertex(x,y);// drawing vertex
  }
  endShape(CLOSE); 
}

I used the Cardioid Curve from the Mathworld curves site to create this project. At first, I thought the movement of the curve was interesting, which is why I chose to use this particular curve. I thought the circular movement of the curve looked like the tornado-like movement of water when it is spun. I tried to express that circular movement of water with cardioid. By making the background color dark blue and the shape itself change colors between different shades of blue, I tried to express water and the spiral movement of water. Everytime I move the mouse left, the shape will turn clockwise and the color will turn vivid blue-green. When the mouse is moved right, the shape will turn counter-clockwise and the color will turn light blue.

Sarah Kang – Project 07 – Curves

curves

//sarah kang
//section c
//sarahk1@andrew.cmu.edu
//project-07-curves

 
 var ang = 0;
 var nPoints = 100; 

function setup() {
    createCanvas(480, 480);
}

function draw() {

    background(0);
    noFill();
    //orange curves
    push();
    translate(width / 2, height / 2);
    strokeWeight(2);
    stroke(255, 159, 28);
    drawHypo1();
    pop();
    //red curves
    push();
    translate(width / 2, height / 2);
    strokeWeight(8);
    stroke(181, 42, 74);
    drawHypo2();
    pop();
    //yellow curves
    push();
    strokeWeight(2);
    stroke(255, 240, 122);
    translate(width / 2, height / 2);
    rotate(radians(ang));
    ang += mouseX / 50;
    drawRan();
    pop();
}
//Ranunculoid Curve 
function drawRan(){ //http://mathworld.wolfram.com/Ranunculoid.html
    var sz = 10;
    //curve
    beginShape();
    for (var i = 0; i < nPoints; i += 0.1){
      var xr = sz * (6 * cos (i) - cos (6 * i));
      var yr = sz * (6 * sin (i) - sin (6 * i));
      vertex(xr, yr);
    }
    endShape();
}

//Hypotrochoid Curve 1
function drawHypo1() { //http://mathworld.wolfram.com/Hypotrochoid.html

    var x;
    var y;
    //controls 
    var h = map(mouseY, 0, height, 0, 80);
    var a = map(mouseX, 0, width, 0, 300);
    var b = a / 8;
    //curve
    beginShape();
    for (var i = 0; i < nPoints; i ++) {
        var t = map(i, 0, 100, 0, TWO_PI)
        x = (a - b) * cos(t) + h * cos(((a - b) / b) * t)
        y = (a - b) * sin(t) - h * sin(((a - b) / b) * t)
        vertex(x, y)
    };
    endShape();
}

//Hypotrochoid Curve 2
function drawHypo2() { //http://mathworld.wolfram.com/Hypotrochoid.html

    var x;
    var y;
    //controls 
    var h = map(mouseY, 0, height, 0, 80);
    var a = map(mouseX, 0, width, 0, 300);
    var b = a / 12;
    //curve
    beginShape();
    for (var i = 0; i < nPoints; i ++) {
        var t = map(i, 0, 100, 0, TWO_PI)
        x = (a - b) * cos(t) + h * cos(((a - b) / b) * t)
        y = (a - b) * sin(t) - h * sin(((a - b) / b) * t)
        vertex(x, y)
    };
    endShape();
}

At first, trying to understand how the math equations were controlled was pretty confusing; after experimenting with the variables, I was able to adjust and change the outputs of the curves equations to how I wanted it to look. Then, I formatted the curves in terms of color and stroke weight to create a flowery design.

Crystal-Xue-Project-07

sketch-135.js

//Crystal Xue
//15104-section B
//luyaox@andrew.cmu.edu
//Project_07


var nPoints = 100;
function setup() {
    createCanvas(480, 480);
}

function draw() {
    background(0);
    translate(width/2, height/2);
    drawEpitrochoid2();
    drawHeart();
    drawEpitrochoid();
}


function drawEpitrochoid2() {

    //geometry rotation
    rotate(map(mouseX, height, 0, TWO_PI, 0));

    //color gradiant
    var from = color(208, 16, 76);
    var to = color(0, 137, 167);
    var cH = lerpColor(from, to, map(mouseY, 0, width, 0 , 1));
    stroke(255);
    strokeWeight(0.2);
    fill(cH);

    //geometry parameters
	var a = map(mouseX, 0 , width, 50, 200);
    var b = a/30;
    var h = map(mouseY,0, height, 100, 0);

    //plotting geometry
	beginShape();
	for (var i = -1; i < 100; i ++) {
		var t = map(i, 0, 100, 0, TWO_PI);
        x = (a+b)*cos(t)-h*cos(((a+b)/b)*t);
        y = (a+b)*sin(t)-h*sin(((a+b)/b)*t);
		vertex(x, y)
	}
	endShape();
}

function drawHeart(){

    //stop heart shapes from rotation
    rotate(map(mouseX, height, 0, 0, TWO_PI));
    push();
    noStroke();
    fill(255,50);

    //size
    var h = map(mouseY, 0, height, 0, 5);

    //for how many layers of heart shapes
    for (var z = 1; z < 8; z++) {

        //plotting geometry
        beginShape();
        for (var i = 0; i < nPoints; i++) {
            var t = map(i, 0, nPoints, 0, TWO_PI);
            //heart equation
            x = 16 * pow(sin(t),3);
            y = -13 * cos(t)+ 5 * cos(2 * t) + 2 * cos(3 * t) + cos(4 * t);
            vertex(x*z*h,y*z*h);
        }
        endShape(CLOSE);
    }
}

function drawEpitrochoid() {

    //geometry rotation
    rotate(map(mouseY, 0, height, 0, TWO_PI));

    //color gradiant
    var from = color(178, 43, 206);
    var to = color(247, 217, 76);
    var cH = lerpColor(from, to, map(mouseX, 0, width, 0 , 1),100);
    stroke(cH);
    strokeWeight(1);
    noFill();

    //geometry parameters
    var a = map(mouseX, 0 , width, 50, 200);
    var b = a/20;
    var h = map(mouseY,0, height, 50, 200);

    //plotting the geometry
	beginShape();
	for (var i = -1; i < 100; i ++) {
		var t = map(i, 0, 100, 0, TWO_PI);
        x = (a+b)*cos(t)-h*cos(((a+b)/b)*t);
        y = (a+b)*sin(t)-h*sin(((a+b)/b)*t);
		vertex(x, y)
	}
	endShape();
}

This project is very intriguing to me because I got to explore the artistic value of math and geometry in a larger span.

state-01
state-02

Carly Sacco – Project 07 – Curves

sketch

//Carly Sacco
//Section C
//csacco@andrew.cmu.edu
//Project 07 - Composition with Curves

var points = 200 //number of points
// for an episprial this will be sections
//the equation for an epispiral
//r = a sec (ntheta)
function setup() {
	createCanvas(480, 480);
}

function draw() {
	background(186, 112, 141);
	//calling the curve functions
	drawCraniodCurve1();
	drawCraniodCurve2();
}
	
function drawCraniodCurve1() {
var x;
var y;
var r;
var a = map(mouseX, 0, width, 0, width / 2); //makes the first epispiral relate to mouseX
var c = map(mouseY, 0, height, 0, height / 2); //makes the second epispiral relate to mouseY
var b = a / 5;
var p = 100;
var theta;

	//calling the curve functions to be drawn
	push();
	translate(width / 2, height / 2);
	fill(158, 200, 222); //blue
	beginShape();
	for (var i = 0; i < points; i += 1) {
		theta = map(i, 0, points, 0, TWO_PI);
		r = (a * (1 / cos((i + points) * theta))) //epispiral equation
		x = r * cos(theta);
		y = r * sin(theta);
		vertex(x, y);
	}
	endShape(CLOSE);
	pop();
}

function drawCraniodCurve2() {
	push();
	translate(width / 2, height / 2);
	fill(255, 77, 77); //red
	beginShape();
	for (var i = 0; i < points; i += 1) {
		var c = map(mouseY, 0, height, 0, height / 2);
		theta = map(i, 0, points, 0, TWO_PI);
		r = (c * (1 / cos((i + points) * theta))) //epispiral equation
		x = r * cos(theta);
		y = r * sin(theta);
		vertex(x, y);
	}
	endShape(CLOSE);
	pop();
}


For this project, I at first was trying to create an image more similar to a typical spirograph. However, after choosing to work with the epispiral, I liked how it almost looked like shattered glass. It reminded me of a comic strips and when an action was done there would be action bubbles. I then chose to animate it similarly to a “POW” action that could be drawn in the comics. Therefore, I overlayed the original epispiral with another with colors that could seem comic book like.